Product Enhancements – Release Notes October 2020
We are happy to announce some new enhancements & fixes:
(Released October 31, 2020)
Note: if you don’t see the same thing in your account, try clearing your cache/cookies or use a “new private window” to refresh the cache.
- Metrics:
- Date Range
- Metrics will display the current month’s data in the tile view and when opening the modal.
- To view different periods of data inside the modal, change the date selected.
- Data Calculations
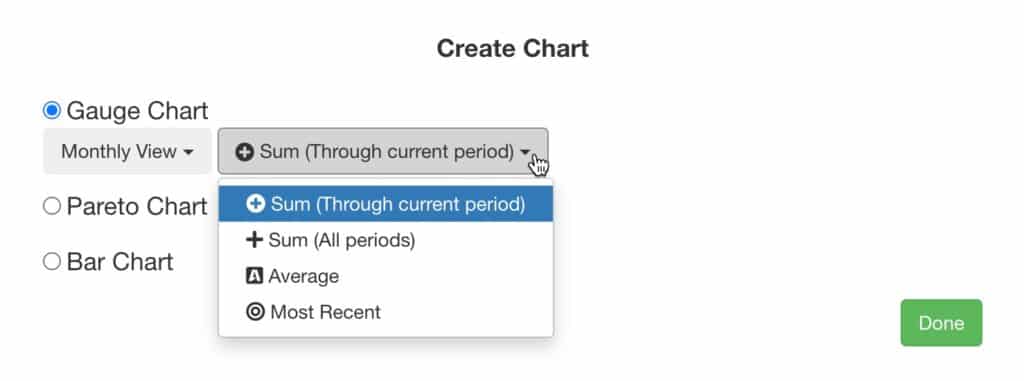
- Toggle the Sum (All Periods), Sum (Through Current Period), Average, and Most Recent and/or the View Type.
- Based on the View Type and Data Mode selected the gauge and bar charts will dynamically adjust its values.
- Date Range
- Custom Dashboards:
- Metric Tiles
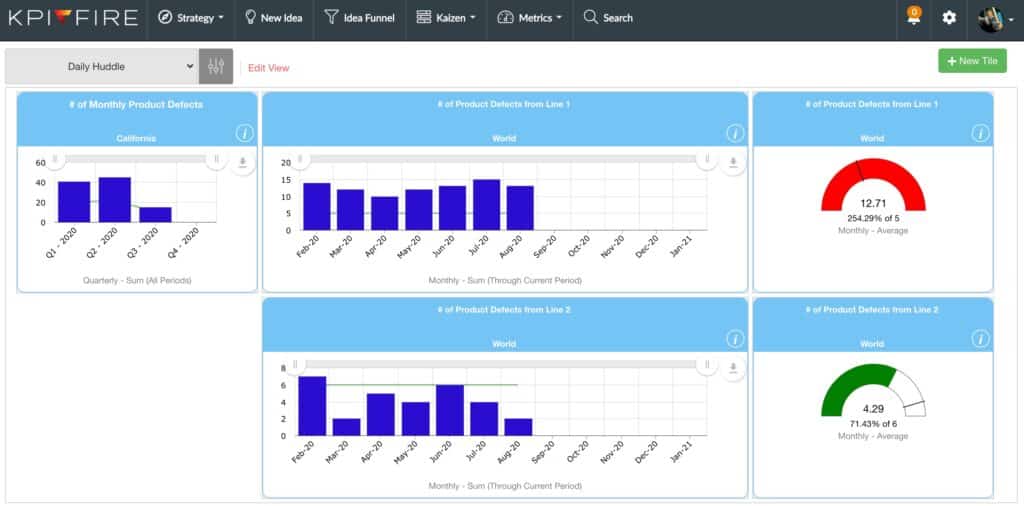
- Have the option to create tiles that show various data calculations of a metric in one place.
- Gauge Chart: the data type and period must be selected. The range is the spread of data that will be used for calculations. The range options available are dependent on the input frequency of the metric. Ranges include Daily, Monthly, and Yearly. The data mode will then draw the chart based on the data set from the range chosen.
- Example: If a daily metric is selected then the options to choose from are Monthly and Yearly. The current date is March 10. Each day has a data value of 10 Target and 10 Actual, January has 31 days, February has 28, and March has 31 days; the target values have been recorded through the end of March.
- Select “Current Month”:
- Sum (All Period): Actual: 100, 32% of Target: 310
- Sum (Through Current Period): Actual: 100, 100% of Target: 100
- Average: 10
- Most Recent: 10
- Select “Current Year”:
- Sum (All Period): Actual: 690, 86% of Target: 800
- Sum (Through Current Period): Actual: 690, 100% of Target: 690
- Average: 10
- Most Recent: 10
- Select “Current Month”:
- Bonus Gauge Chart: Monthly Metric- Current Month.
- A monthly input frequency only has one data entry for each month. When Current Month is selected a single data value will be displayed for the gauge chart. There will be no difference between the data modes because there are no calculation that can be run for a single value.
- Metric Tiles
Projects
- Create new project
- Performance Enhancement- Creating a new project takes <5 seconds with up to 100 tasks and 5 groups
- Header
- UI- “Project ID” has been updated to “Project #”
- Charter
- Able to hide the Organize tile in the Project and Workflow Charter
- Team Roles
- View only license permissions do not allow for editing of any type, including on one’s own tasks within a project
- Tasks
- NEW- Tasks within groups can be filtered and sorted by the task owner’s column
- Project List- Full Export
- Project # represents the sequence of projects within your company account.
- NEW page for custom text tiles created through project tabs
- UI Update
- Areas of app with “Planned Start Date” have been updated to “Target Start Date”
- Project Summary Report
- Active Project Resource Loading table updated to include Champion roles.
- Global Filter
- Departments now have a sort and filter integrated into the dropdown
- New Idea Page
- NEW FEATURE: customize the background of the New Idea page to provide additional guidance for idea submissions and co-brand a main page of the app.
- Go to the Settings –> Settings tab, at the bottom there is a file upload for the New Idea Page background image.
- Main Search
- Can search projects by Project #
- Workflow Tasks
- Create a workflow template with tasks assigned to the Project Leader (PL)
- When that workflow is selected during project creation or merge/replace the workflow the task will assign to the user that is leader of the project
- Project Workflows
- Assign a higher-level workflow to a project in a lower-level department.
- As an admin, create a Workflow that is only accessible to a higher-level department- select only that department in the workflow visibility settings.
- Then create a project (must be in same department as workflow) and select the higher-level workflow.
- Once the project is created, change the department of the project to a lower-level. That project will maintain the higher-level workflow without broadening access to the restricted workflow.
- Metric Bowling View
- Improved Date Selector
- When view type is changed to hourly or daily, there is now the option to select a specific day or month to display

- Project Benefits from Templates
- Edit the title of project benefits from workflow templates in individual projects
- Adjust the workflow settings to unlocked in the project benefits tab of the workflow settings.
- To update workflow settings in projects already existing, merge the same workflow from the header.
- Users on project team will be able to edit the project benefit tiles. More on team roles and user license permissions.


- NEW Custom Dashboard Charts:
- Metric Charts- Select the frequency and data mode for any gauge or bar chart.
- Create dashboards that display multiple charts for the same metric.
- Read more about how to configure Custom Dashboards


