KPI Fire is software for Continuous Improvement. In addition to helping track hundreds of millions of dollars in improvement projects inside customer’s organizations, we have been continually making improvements to the software itself. Many of these improvements have come directly from customers and are helping make KPI Fire the best software for Operational Excellence.
Recent Updates and links to more info about each fix.
- Add Last Updated Date to the Metric tile hover over. This makes it easier to tell if a metric is out of date.
- Fixed bugs
- Tag Feature for Project Charter: Tag a project to organize it or find it later. Can be used to tag projects for a stage gate review, or for any other organization or grouping purpose.
- Improved navigation on Project Benefits tab.
- mobile beta for iPhone and Android now available!
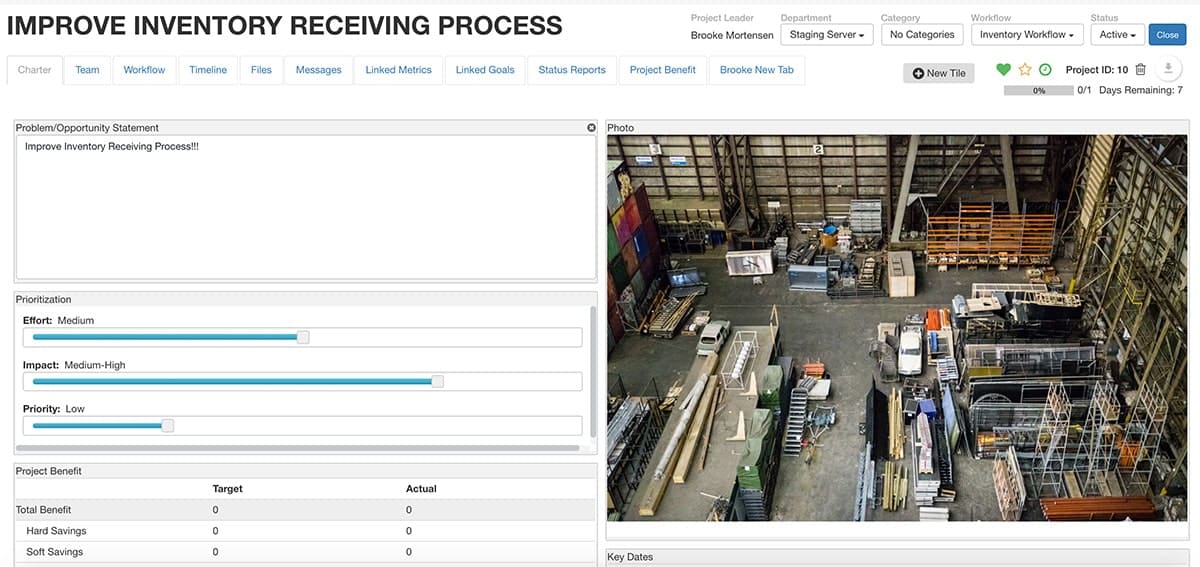
- add a photo in your Project Charter –
- Remove extra levels (below L1 & L2) in Project benefit Charter.
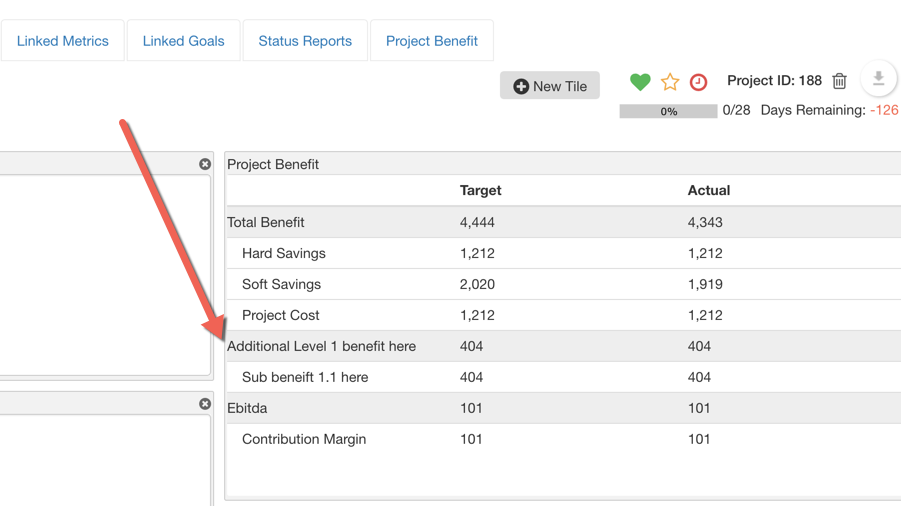
- Now showing additional top level metrics on Project Charter benefit tile.
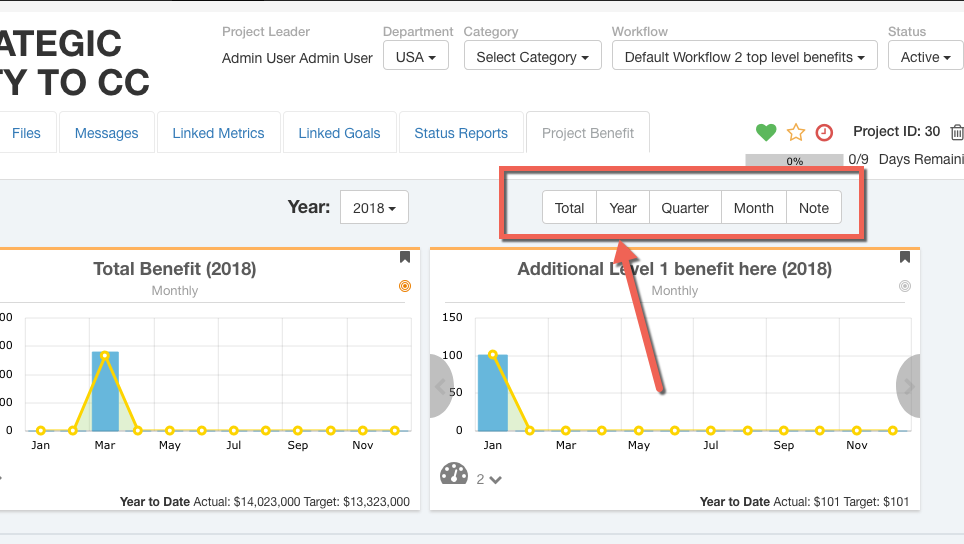
- Added button navigation to toggle to Project Benefit views
- Views can now be edited by Creator or Admin only. All users can now see who created the view.
- Changes to Executive License type. Executive license can now be used as a department admin.
- Zapier Integration
- Metric Charts. This new view on Metrics tab has summaries of all of your metrics on a single page.

- Changes to how filters work. Click the “x” to reset a filter to the user or department defaults.
- Project Timeline View
- Add Global Filters in Saved View modal
- Project List View: Control column width & expand columns for notes & Add project start date to editable columns
- Create Teams: Add teams to projects to add multiple users at once
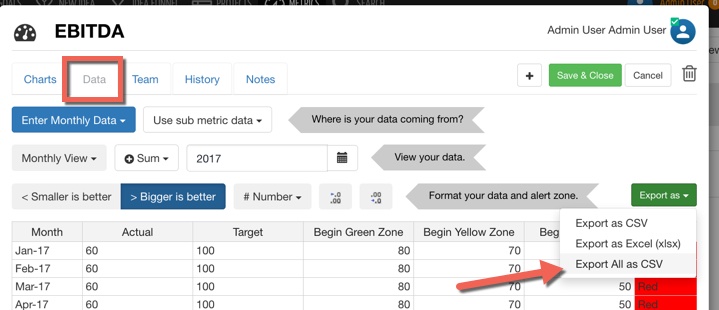
- Export All Metric: Added option to Export All as CSV.
- Weekly Metric Import
- Fix issue affecting drag/drop of tasks with sub tasks and move to top.
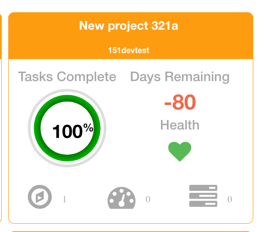
- Add Project health heart to the project tile in tile view
- New Navigation to the Dashboard feature from Metrics page selector dropdown.
- Add new indicator of filter applied to project summary headers

- Metrics & Sub-metrics drill down: We will now display the primary metric & sub metrics on the metric Detail Screen. Sub metrics have colored circle to indicate their status. The sub metrics are clickable for a drill down effect.

- Metric Import now imports individual data points as well as entire data sets
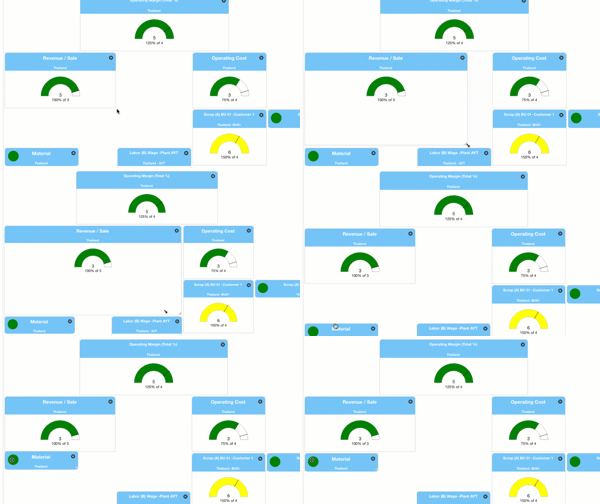
- More configurable layouts for Metric dashboards
- Link Projects to Projects on Project Charter Tab
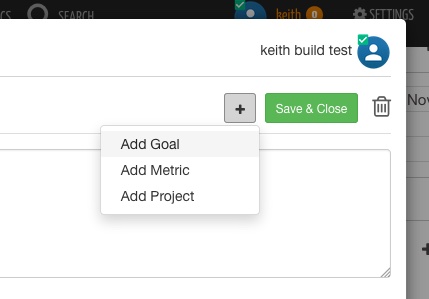
- Link goal/metric/project from metric detail screen

- Passwords now allow more variety in special characters: ( ^&*()_-+=~`<,>./?[];:’”)
- Show date of file upload next to file name
- Project Export: include Project Name column
- Multi-select now works with changing dates on multiple tasks at once
- Bug fixes
- Add Created by & Created Date to Task Notes
- Add Time Stamp feature to Task notes
- Add Skip Weekends option for date calculations
- Bug fixes
- Sub-Tasks: Mouseover the icon to display the subtask controls
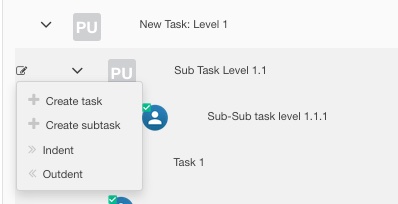
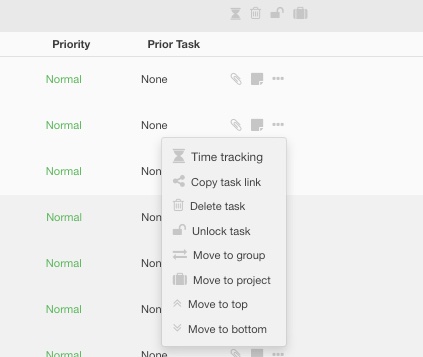
- Added Actions for more quickly moving tasks to top or bottom of a task group & simplified the icons displayed on each task row.
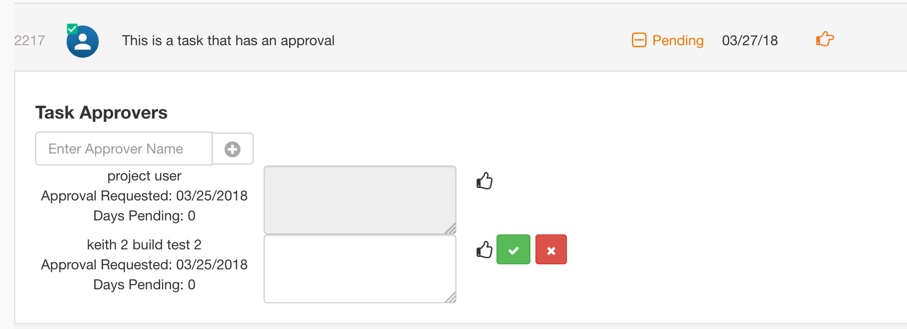
- Approval request now track Request Date, Number of Days since request was sent, and allow for a comment by approver.
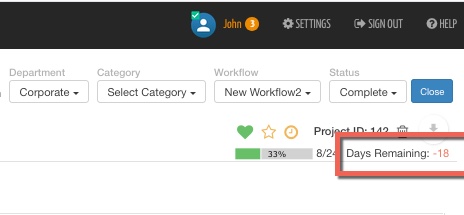
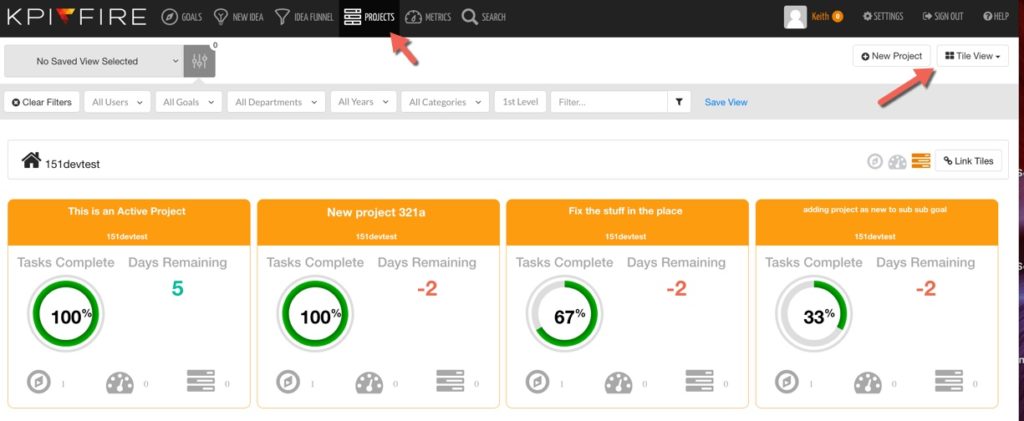
- Project Tile View now shows # Days remaining in a project.
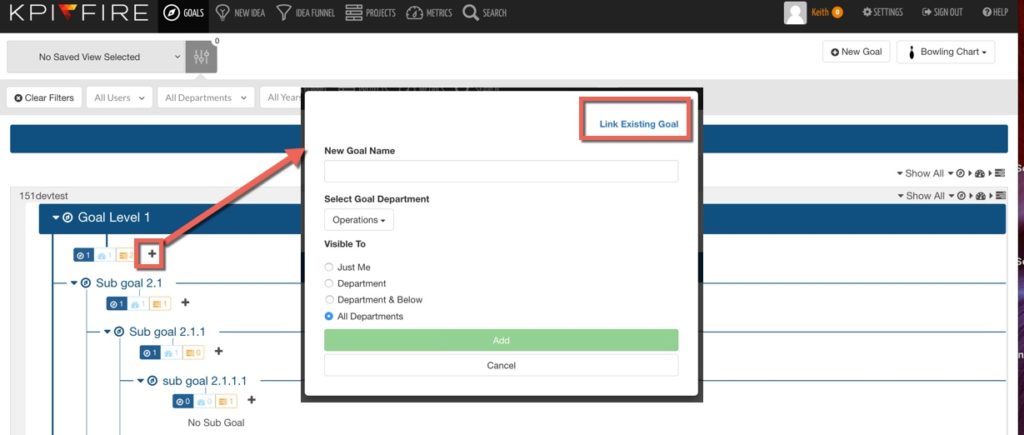
- You can now Link Existing Goals/Metrics/Projects from the Goal-Bowling view “add button”
- Users can now set a default saved view

- Add Control Status for Project Status

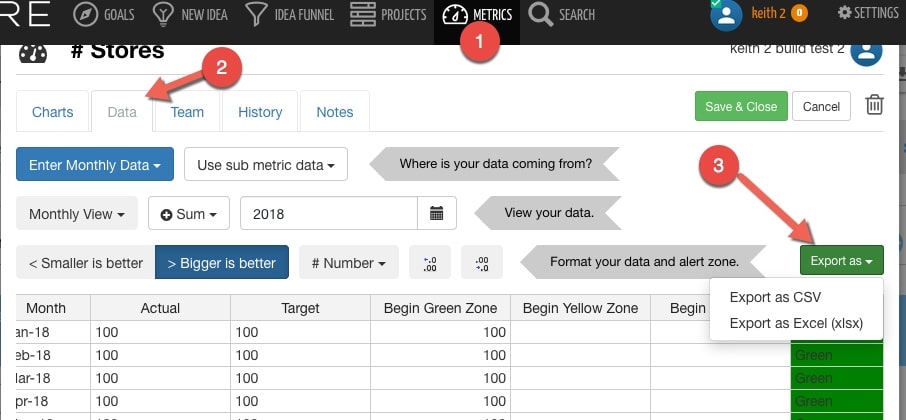
- Metric Export format now matches Metric Import requirements. This makes it easier to export an existing metric and edit the data in Excel and re-import or create similar metrics.
- Added note on Project Benefits to add costs as negative numbers.
- Project Tasks mass update feature now allows to unselect all tasks, and select by task, by task group, or by all tasks.
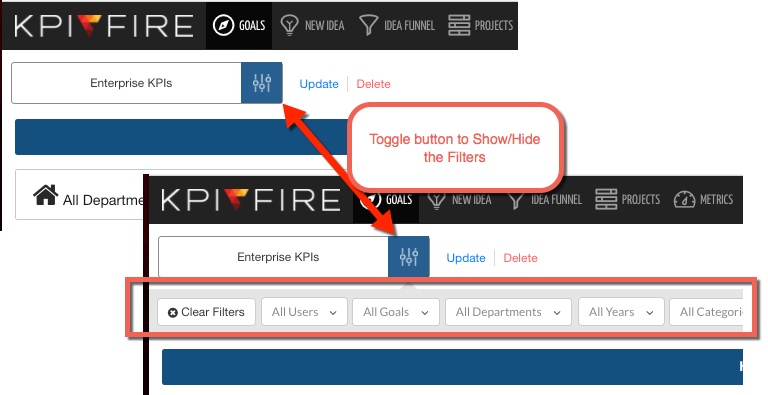
- New “Saved Filters / Saved Views” Feature allows you to save filter configurations for easily switching between specific views. This makes it even easier to on-board new groups of users by creating views that show the data in just the right ways.
- Saved Filters has Toggle Open/Close so you can choose which display you prefer.
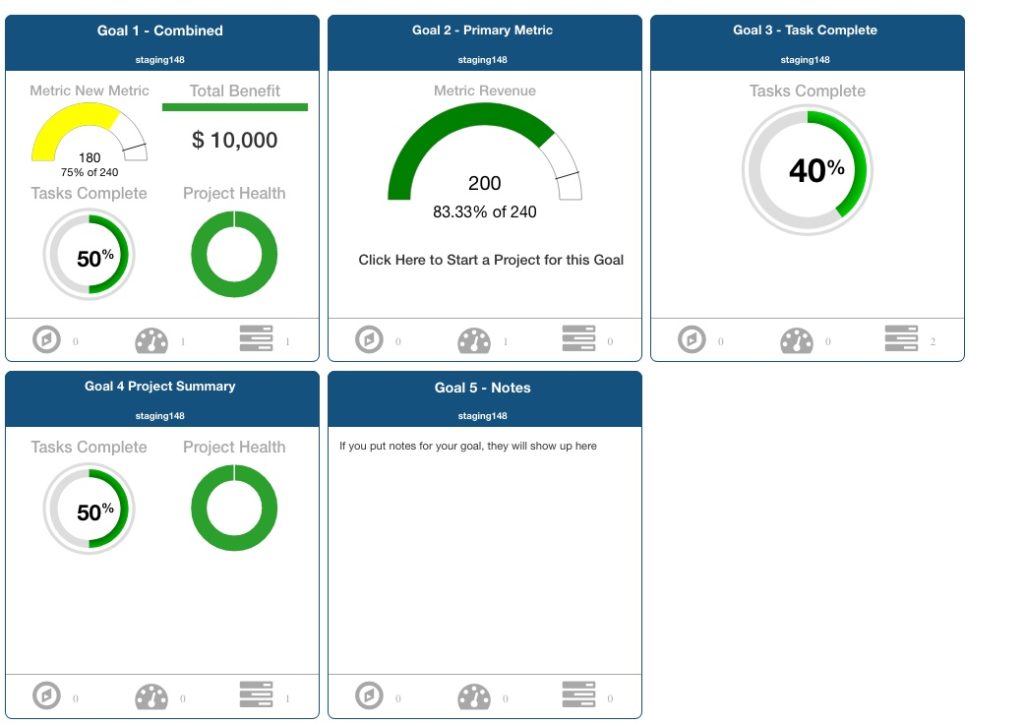
- Goal Tile: Added 5 options for changing the default display on Goal Tiles.
- Project List View: Add Filter for Current Stage
- Linked Goals & Linked Metrics can now be displayed on your Project Charter. You can configure these as blocks on your workflow setup.
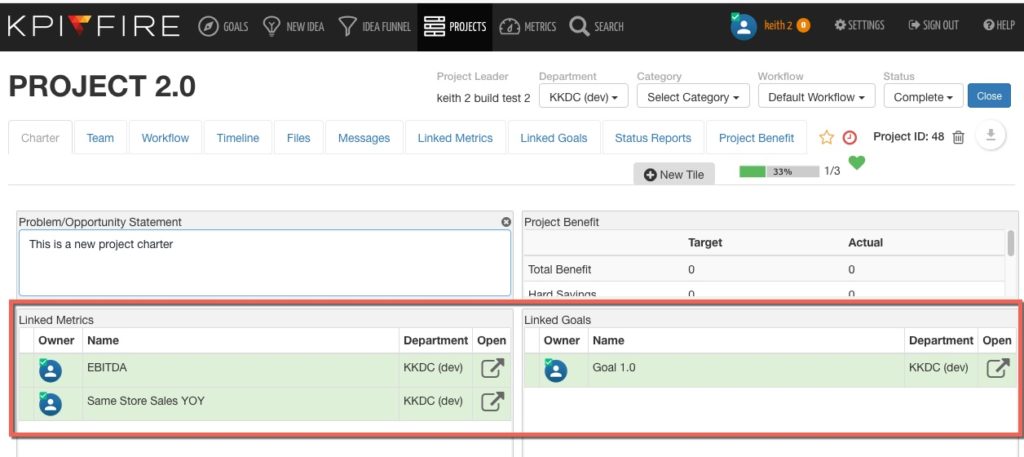
- Improvements to the Goal-Bowling Chart page. Making easier to see the connections between goals, metrics, and projects.
- Multi-Year option for Metric Charts.
- Multi-Select tasks now allows you to choose multiple individual tasks or all tasks when making changes to status, or due date.
- Project Benefits: Added year selection filter & Year label to all benefit tabs.
- Add Tagline to top of Goals Page: Great for displaying your company mission or purpose with your goals.

- Add tagline in users notifications screen
- Allow user configure for default home page
- Goal tile Notes toggle: You can now toggle all goal tabs from summary to notes view.
- New Custom Field added for Users Table. You can use this field to keep track of Certification Levels or any other User specific attribute. The user table is now exportable with this info included.
- Goal tile view now shows Parent & Child Goal names as clickable links.
- Goal Detail View now has option to add new Goal/Metric/Project from this view.
- Projects: Project Benefits within a single project can now be filtered by year.
- Project Start & End Dates now have separate values for Planned & Actual.
