Project Benefits
Converting Process Metric Improvements into Business Value.
What are Project Benefits?
Project Benefits are the measurements of business value that an improvement project can deliver to your organization. Keeping track of Project Benefits is potentially the most important component of any project and specifically a Lean/6 Sigma project because these benefits will eventually be used to determine the effectiveness of your program and may be used to make decisions that expand your Lean program or cut funding to it. Ideally, these project benefits should be converted into Annualized Dollars*, and identified as Hard Savings* or Soft Savings*. These calculations can be used to prioritize projects, and to recognize team members for their contributions.
How to Calculate:
- Identify the Improvement you made or plan to make. This is usually the “Goal Statement” or Target Outcome from the Project Charter.
- Identify the Metric to be improved. Identify its Current state value and future state value. The difference between them is the potential impact of the process improvement. This metric should be linked in your charter in the Linked Metrics tile.
- Translate the value of the change in process metric into Dollars.
- Annualize the Savings. Most organizations implementing Lean choose to count improvement projects on a 12 month basis.
Example #1: Reduce Cost of Defects on BB Production Line
- Identify the Improvement you made or plan to make.
example 1: Reduce defects on BB line - Identify & Quantify the Metric which were improved.
example 1: # Defects, % Defects, Caused Variable Costs or Costs of goods sold to be reduced. - Translate the change in process metric into Dollars.
example 1: We make 1000 units per month at a cost of $900,000. 2% are defective.
Cost of Materials is $900,000 per month. Each 1% defect is costing $9,000/month. - Annualize the Savings. Most organizations implementing Lean choose to count improvement projects on a 12 month basis.
example 1: a 1% improvement in defect rate would save us $9,000/month x 12 months = $108,000
If you would like more examples and an excel template to help you calculate additional types or project savings you can download an additional template.

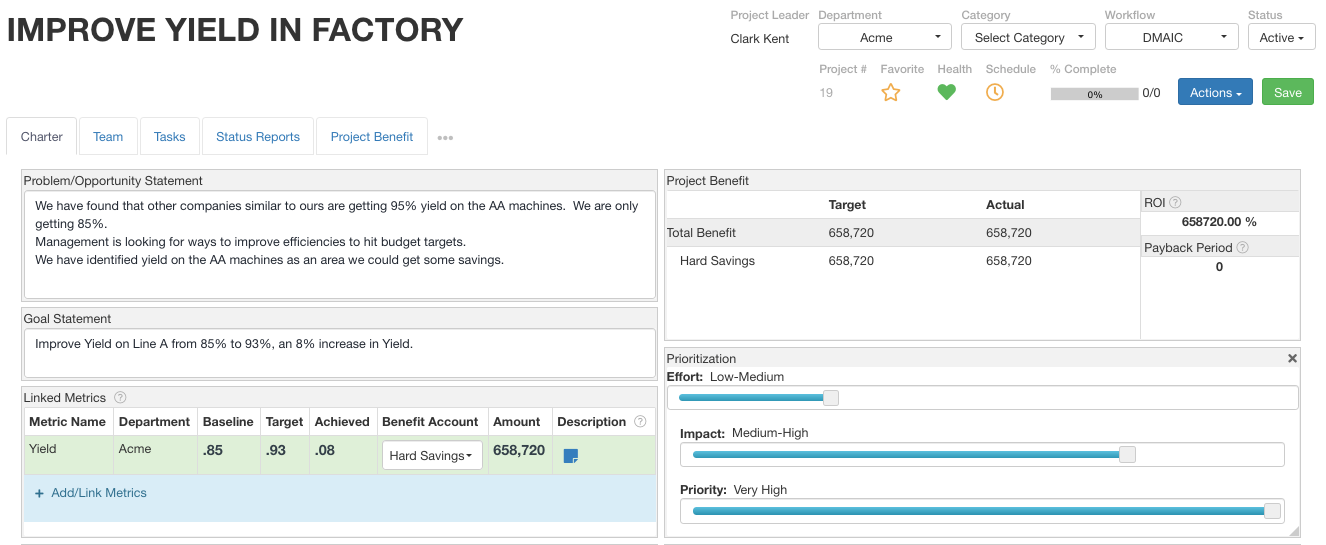
Example #2: Improve yield in Factory
- Identify the Improvement you made or plan to make. This is usually the “Goal Statement” or Target Outcome from the Project Charter.
example 2: We worked on yield issues in the factory - Identify & Quantify the Metric which were improved.
example 2: We improved the yield of the product from 85% to 93%, an 8% increase. - Translate the change in process metric into Dollars.
example 2: 8% yield at $23 per unit = $1.84 saved per unit. - Annualize the Savings. Most organizations implementing Lean choose to count improvement projects on a 12 month basis.
example 2: 8% yield at $23 per unit for 358,000 units = $658, 720 per year.
If you would like more examples and an excel template to help you calculate additional types or project savings you can download an additional template.
*Many organizations choose to Annualize project savings or to count 12 months worth of a single process improvement project. KPI Fire allows you to input values over multiple years, or to use other types of savings types, not limited to Hard or Soft Savings.
Check out this resource for determining Hard Savings vs. Soft Savings in Lean Continuous Improvement Projects
“Keeping track of Project Benefits is the most important component of any Lean/6 Sigma project because these benefits will eventually be used to determine the effectiveness of your program and may be used to make decisions that expand your Lean program or cut funding to it. One of the easiest failure points to avoid in your Lean programs is failing to track Project Benefits”, Cedro Toro
Set up Options
Admin Settings for Project Benefit Accounts & Project Budgets
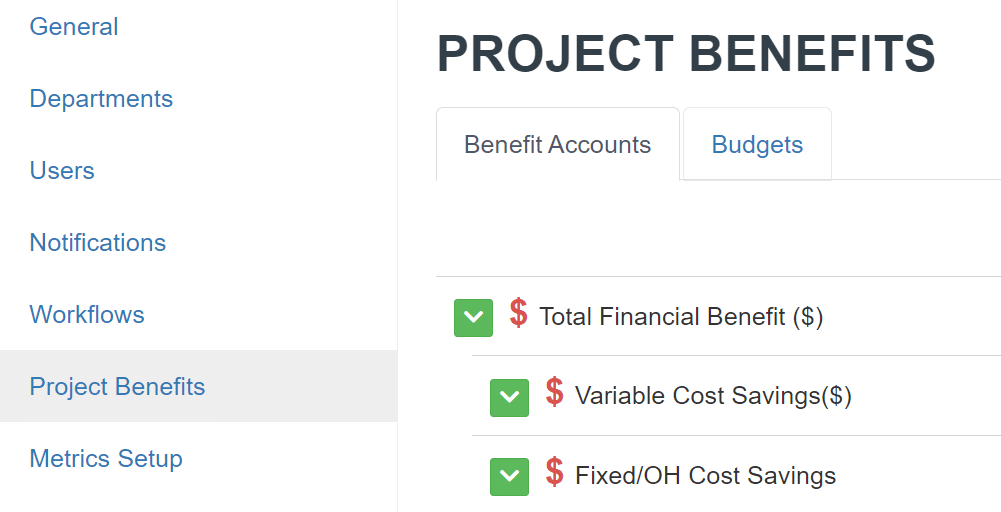
- The Project Benefits available for selection on each project are configured by Admin users in Settings>>Project Benefits>>Benefit Accounts.
- Click on Project Benefit account name for additional options.
Project Benefit Budgets
- The budgets tab can be used to create Company or Department targets for specific benefit accounts.
- A typical example of this would be: Company budget for Cost Savings Benefit Account is $1,000,000. This amount is allocated to 2 departments: Industrial for $700,000 and Commercial for $300,000.
Note:
- All project benefits are independent values. Sub department budgets do not neccesarily need to add up to the parent department budget amount. This allows for over-allocating benefit account budgets.
Project Benefit Target Lock Date (optional):
If a date is entered here it will restrict the input of any project benefit targets before this date.
Project Benefit Actual Lock Date (optional):
If a date is entered here it will restrict the input of any project benefit targets before this date.
Project Benefit Import:
This import utility can be used to import or migrate historical project benefit data. This import will NOT create new benefit accounts. Project Benefit accounts should be created manually by an admin user.
Show Forecast
The typical fields for Project Benefit Accounts are Target & Actual. This option will enable an additional field in project benefits: Forecast.
Note: if an Actual value is input for a given month, the Forecast for that month will be updated.
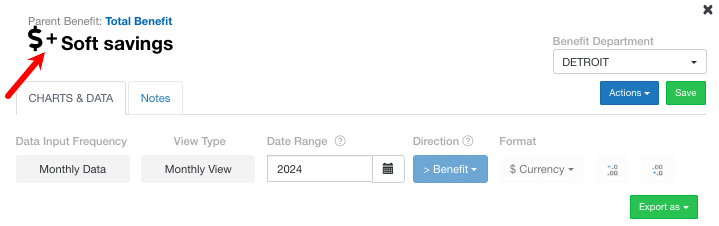
Direction: Benefit or Cost
- Benefits:
- Added to parent Benefits.
- Can be input as negative or positive values.
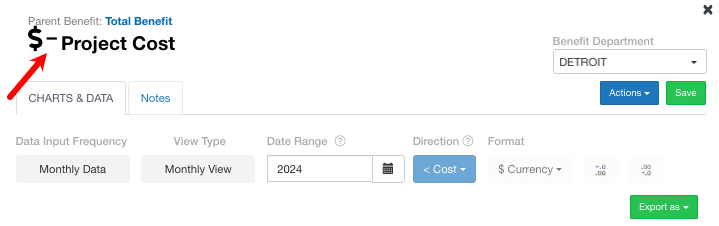
- Costs:
- Subtracted from parent Benefits.
- Input is automatically entered as negative values.
- Best Practice: Use the “< Cost” direction for all cost benefits to gain insight with ROI and Payback Period calculations.
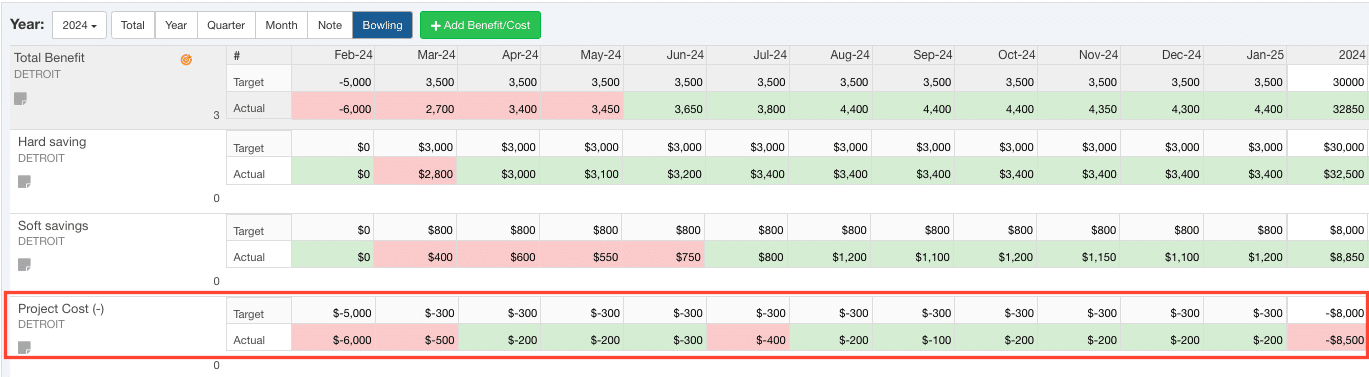
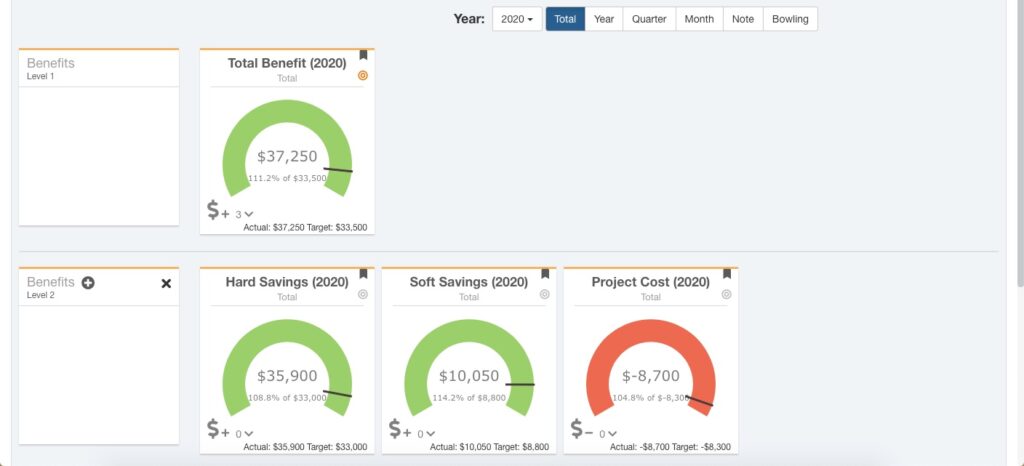
Project Benefit Tile Views
- Multiple display options available for visualizing project benefits over time (Total,Year, Quarter, Month, Bowling)
- Top-Level Benefits can be added by editing the Project Workflow, if unlocked.
- Add Sub-Benefits by selecting the parent Benefit and then clicking the plus sign in the level beneath it
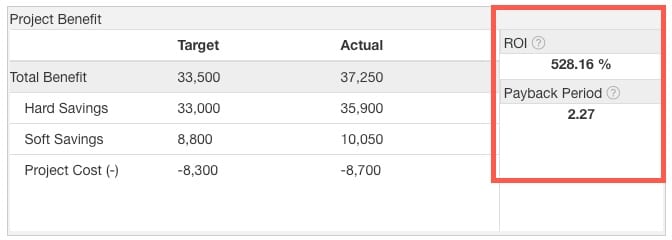
Project Charter
- Calculations use gross Benefits and Costs, not Total (Net) Benefit
- ROI: Return on Investment = Total Actual Benefits / Total Actual Costs.
- Costs must be set to “< Cost” direction to roll up these calculations.
- Payback Period: Payback Period (months) = Total Actual Costs / (Total Actual Benefits / 12).
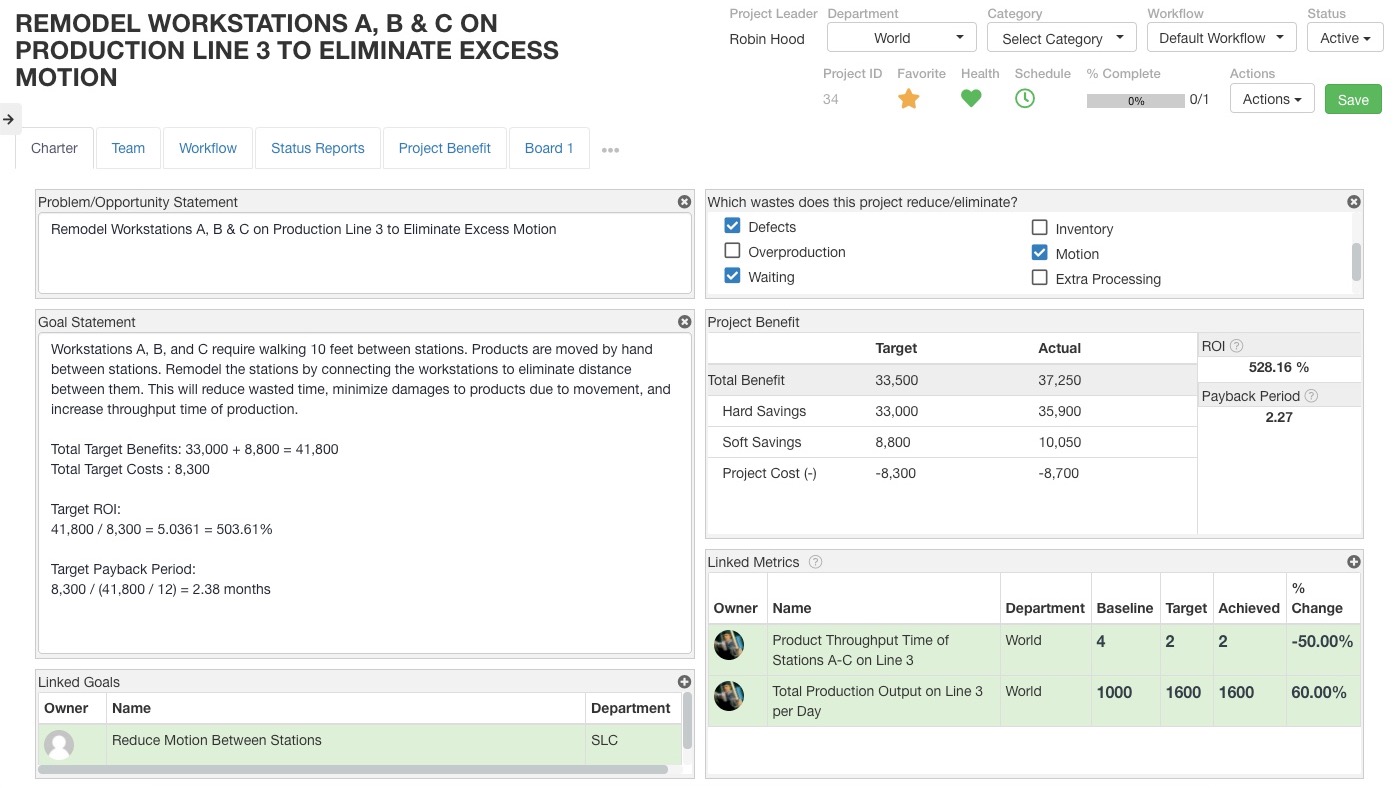
Putting It All Together
Project Charter:
- Use the Problem Statement, Goal Statement, and Scope fields to describe the project.
- Check the relevant Tags
- Link the project to Process Metrics
- Convert the Process Metric change to Dollars and input annualized data from the Project Benefits to view totals, ROI, and Payback Period
Other Popular Project Benefit Configurations:
The default template in KPI Fire will use Total Savings = Hard Savings(+), Soft Savings(+), and Project Costs(-), however some customer have configured other Project Benefit types to match different approaches to quantifying Project Benefits. Here are a few examples:
A) Project Benefits with focus on identifying the 8 Wastes:
Total Savings (Level 1)
-Hard Savings (Level 2)
–Reduce Defects (Level 3)
–Reduce Inventory (Level 3)
-Soft Savings (Level 2)
–Over Production (Level 3)
–Waiting (Level 3)
–Non-Utilized Talent (Level 3)
–Transportation (Level 3)
–Motion (Level 3)
–Excess Processing (Level 3)
B) Project Benefits for NIST/MEP Program Goals
-Cost Savings (Level 1)
–Hard Savings (Level 2)
–Soft Savings (Level 2)
-Sales Impact (Level 1)
–New Sales (Level 2)
–Retained Sales (Level 2)
-Employee Impact (Level 1)
–Retained Impact (Level 2)
–New Employees(Level 2)
-Investment Impact (Level 1)
–Investments made (Level 2)
–Investments avoided (Level 2)
C) EBITDA Impact with Sub Accounts:
Net Ebitda Gain
-Cost Reduction
–Variable Cost Reduction
–Fixed Cost Reduction
–Direct Cost Reduction
-Ebitda Gain from Revenue
-Expenses (-)
–Ongoing Expenses(-)
–One time Expenses(-)
–Amortized Capital Expenses(-)
Working Capital
-Accounts Payable (DPO)(-)
-Accounts Receivable(DSO)
-Inventory Gains
Capital Investments (-)


