Pending/Scheduled for April
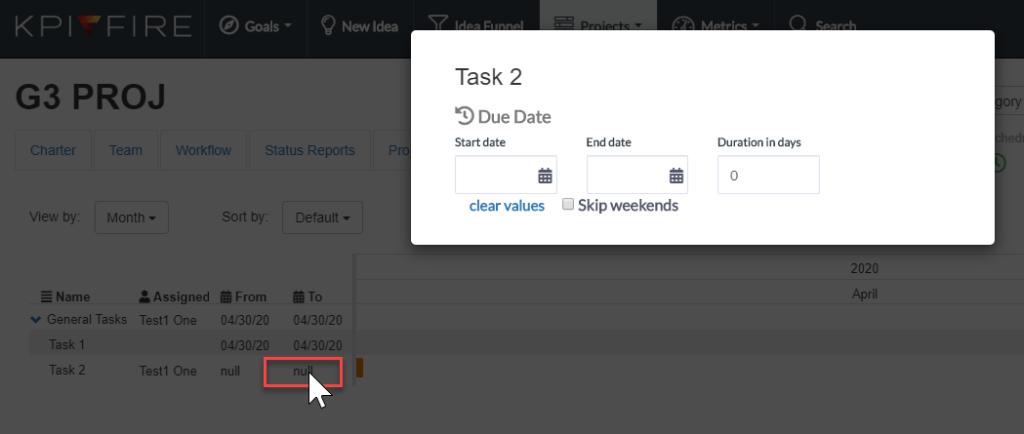
- Project View- Timeline will display tasks without start/end dates. Click on “null” value to add start/end date.

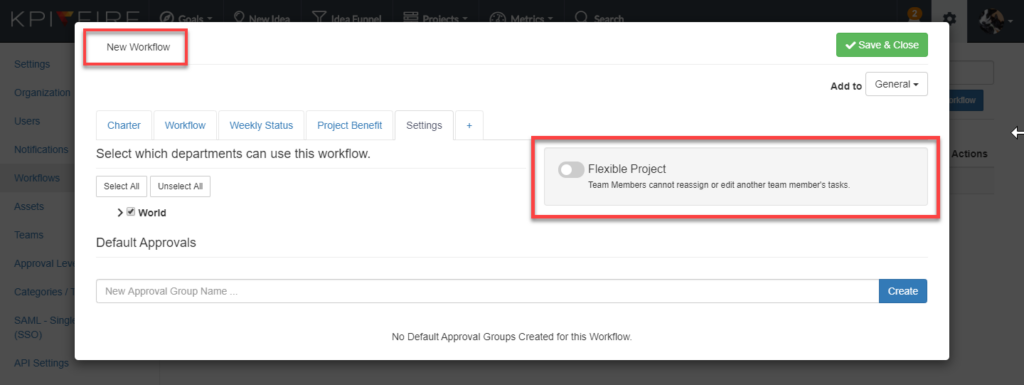
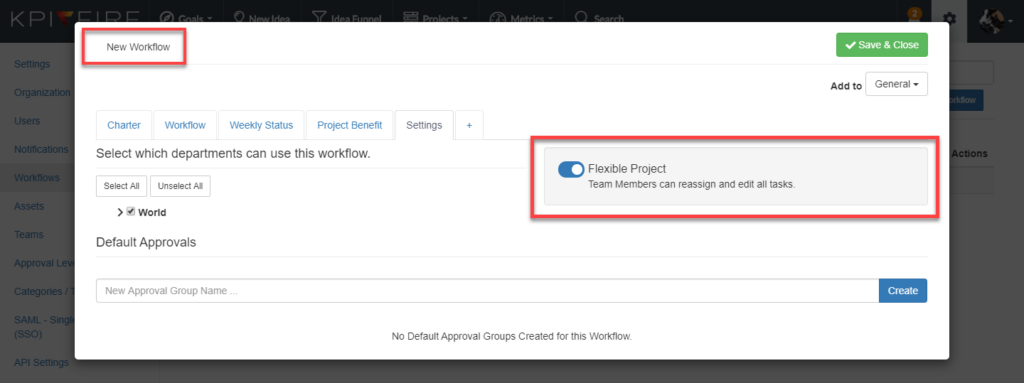
- NEW FEATURE: Settings >> Workflow >> New Workflow – Create a new workflow using the Flexible Project toggle feature. Manage who has the ability to edit and reassign tasks in projects.
- Goal List View- Header row sticks at top of the screen as you scroll through the goal list.

- Project List View- Header row sticks at top of the screen as you scroll through the project list.

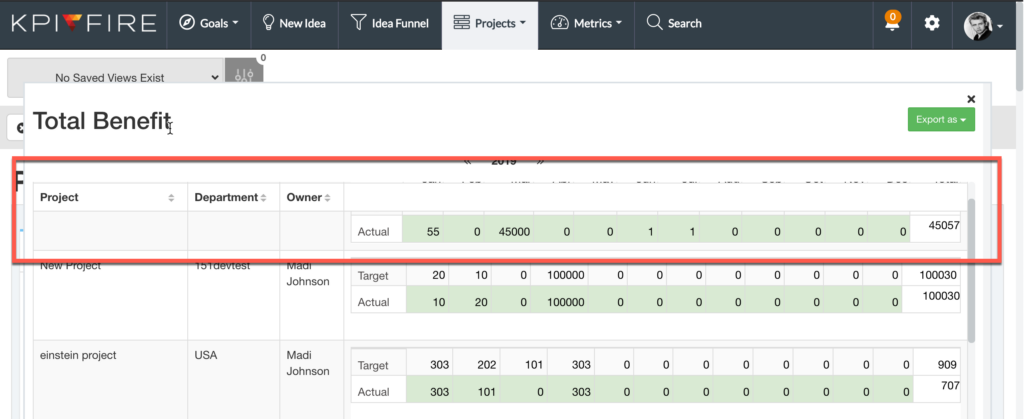
- Project Benefits Report- Header row sticks at top of the screen as you scroll through the project benefits.
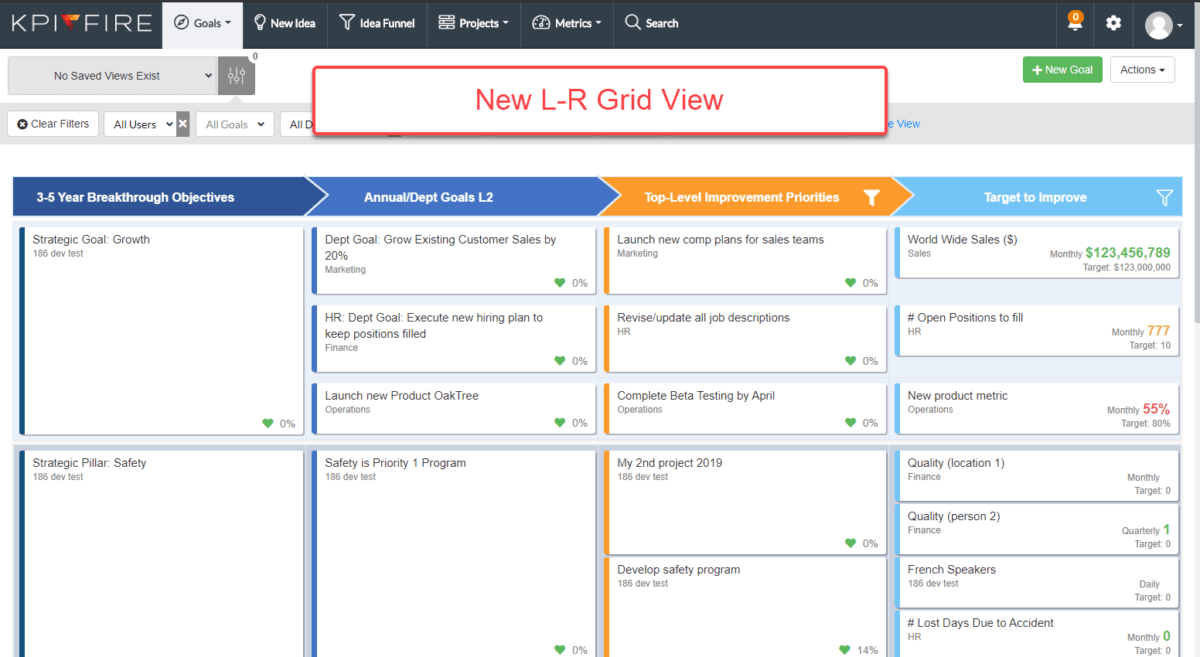
- NEW Goal Grid View: Left-Right Grid View replaces old grid view. Click Here for more detailed information and a walk-through of the new view.
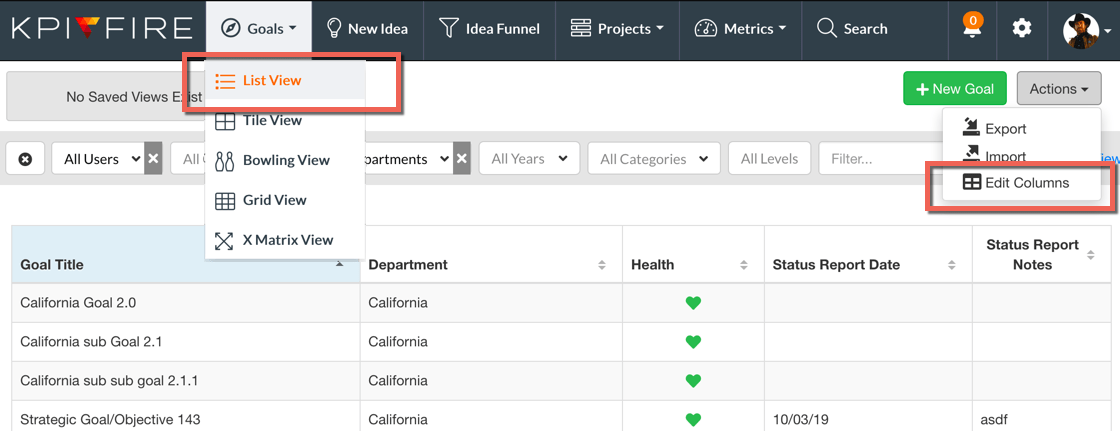
- Goal List View: Actions >> “Edit Columns” allows user to manage which columns are displayed.
- Goal Detail Page: Added Department name to Project Tile
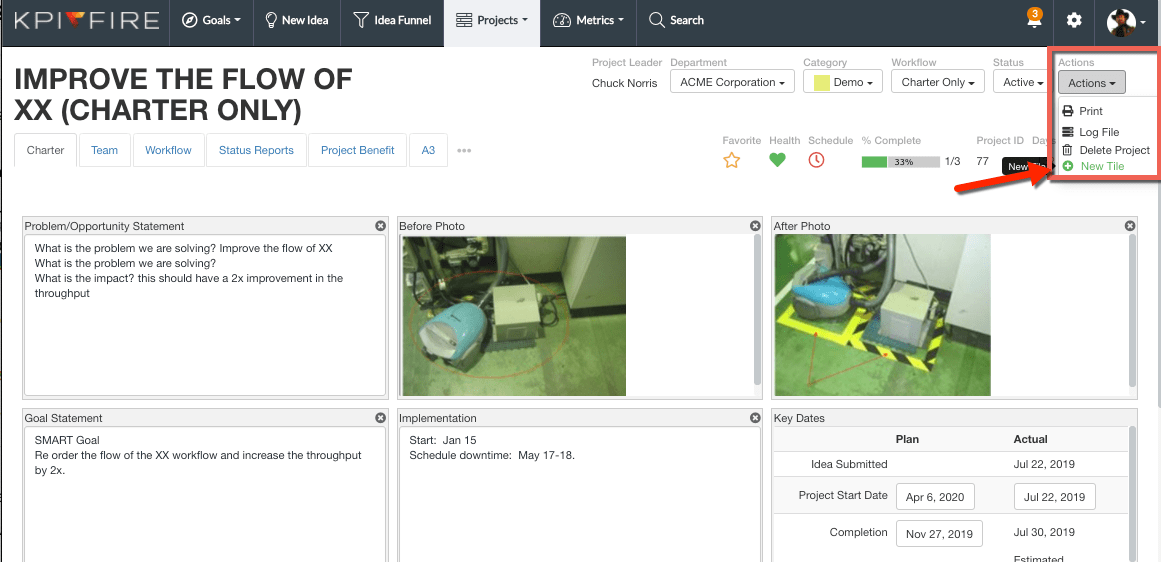
- Project Charter: Actions >> “New Tile” allows user to add multiple photos to project charter.
- Fixed: Deleting a task not recalculating the % complete on a task group.
- Fixed: Grid view, some linked projects not showing up.
- Project Timeline View: Now control Chart Range.

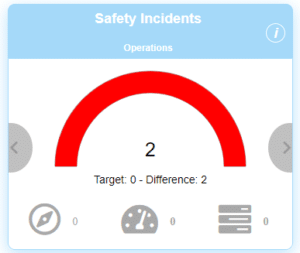
- Metrics View: Allows target value of zero. Sum reports as a difference rather than percentage.
