Build a dynamic X Matrix that is better than Excel.
Connecting Strategies, Results, Actions, and Process metrics…. All in 1 page or less.
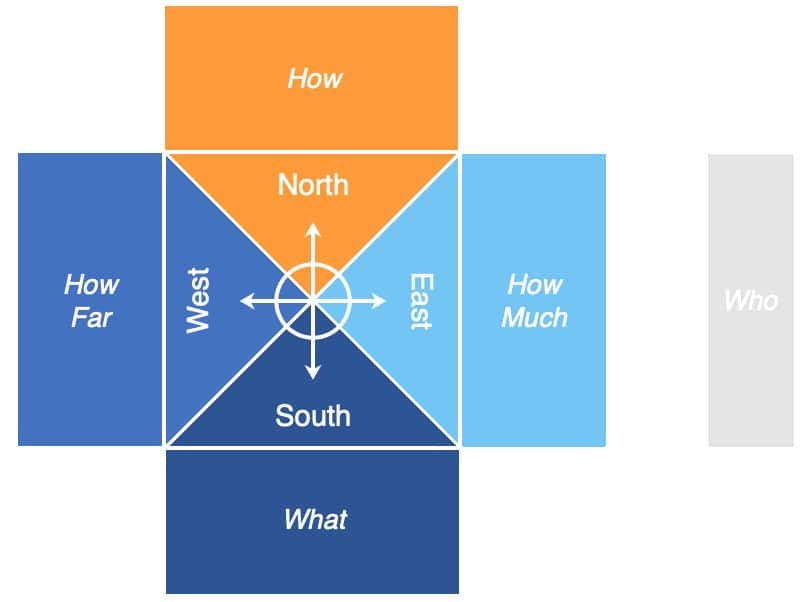
The X-Matrix, or x-type matrix is a popular tool for strategic planning. It can be useful for connecting the big picture with the “what” and the “who” will move the strategies forward.
The X Matrix quadrants are often referred to directionally like a compass
South / Bottom = Top-level Initiatives or Results Desired
West / Left = 2nd Level Initiatives or Strategies
North / Top = Projects and 3rd Level Initiatives
East / Right = Targets to Improve /Metrics


Add a New or Existing Goal:
- 2 Options: Use the “+” button in the bottom quadrant, or the “+ Add Goal” button in the top right corner for top-level goals

- Add New or Existing Goal Modal:
-
- To display an existing goal, type the name of the goal in the input field and then select it from the search list below, then press “Update.”
- To create and display a new goal, click in the input field and type the name of the new goal, then press “Add New.
Add a New 2nd or 3rd Level Goal, Project, or Metric:
- Start by clicking on the parent goal or project to open its modal or page
- Add a new or existing goal/project/metric from within the modal or project page. It will then display on the X Matrix dashboard.
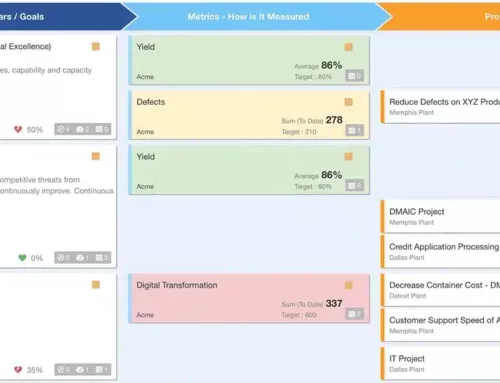
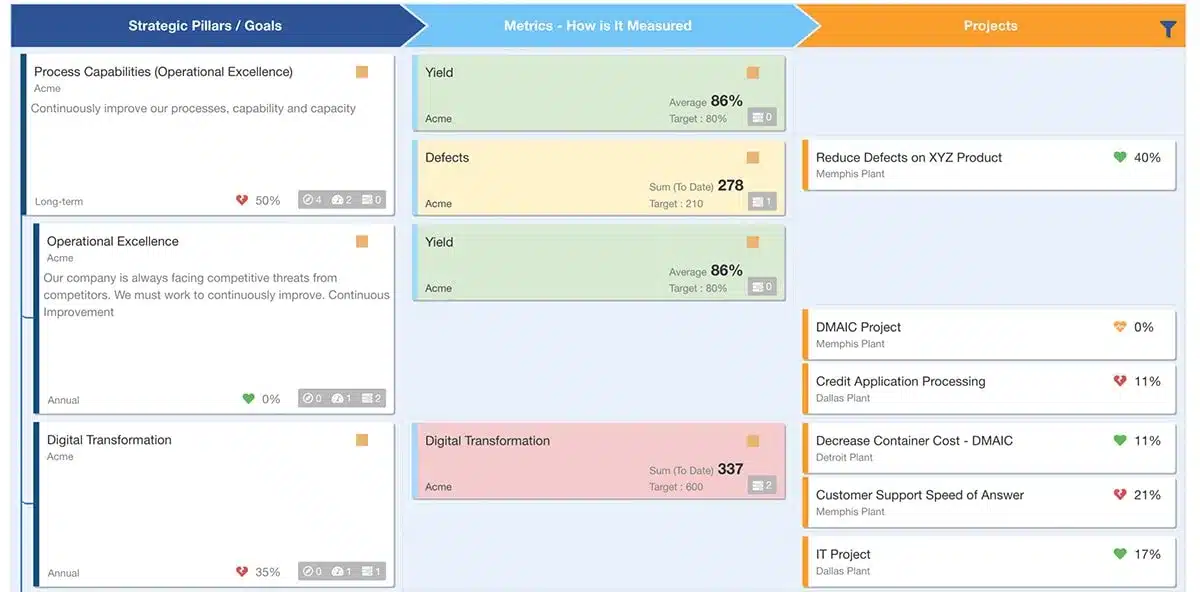
The X Matrix Dashboard will display all goals, projects, and metrics linked to top-level goals. To drill down to specific level 2 goal, create a new dashboard and set that goal as a level 1 goal.
Build a Level 1 X Matrix
4. Hover over a goal/project/metric to show the direct relationships
5. By default, links are created as strong relationships represented as solid circles. To create a weak relationship in the X Matrix Dashboard, double-click a solid dot or single-click an empty square.
1. Create a new X Matrix Dashboard

2. Create a new top-level goal by typing in the name and “Add New”

3. Click to open the top-level goal, create a new 2nd-level goal or link an existing one from the “Actions” dropdown


Build a Level 2 X Matrix
1. Create a new X Matrix Dashboard

2. Select the 2nd-level goals from the previous dashboard

3. Change the quadrant headers to reflect the rotation of goal levels, click the default title to edit the text

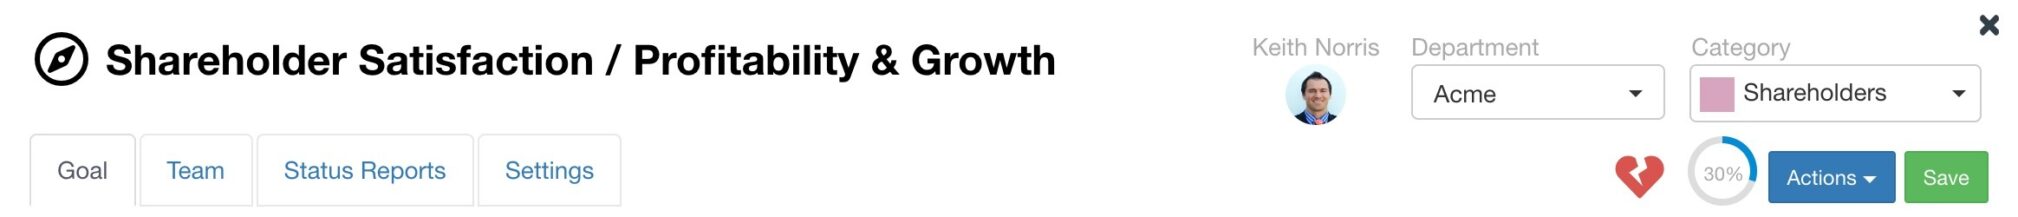
3. The users shown reflect the goal/metric owners or project leaders. Navigate into the team tab by clicking on the goal/project/metric to edit the users.


3. The users will display in the the far-right, “who” section

Create multiple X Matrix dashboards to rotate the views and drill down into lower-level goals


