KPI: Key Performance Indicator
A KPI, or Key Performance Indicator is a metric that specifically chosen to indicate progress toward an important objective.
KPIs are what companies use to compare their business processes to the industry’s best practices.
KPI Fire is a tool executives can use to make an informed, data driven decision by quickly identifying strengths and weaknesses with our visual KPI Dashboard.
What is the difference between a KPI and a Metric?

- A metric is any numerical value that represents a measurement.
- It is true that all KPIs are metrics; but not all metrics merit the title of KPI.
- KPIs are distinct and concise metrics that are essential in evaluating a company’s operations or goals.
What are some common KPIs?
Varying by definition across industries, the following are generally accepted KPIs:
- Net Profit Margin – the percent of revenue left after expenses have been deductive over total revenue.
- Total Costs.
- Safety (Total Incidents).
- Net Promoter Score (NPS) – the willingness of customers to recommend a product/service.
- Quality Index
- Share Price – the current selling price for one share of company stock.
- Customer Satisfaction.
- Labor Costs.
- Savings from Improvement Initiatives: (Hard Savings, Soft Savings).
- Employee Turnover Rate – the percent of employees leaving the company and replaced by new employees.
- Cost of Goods Sold.
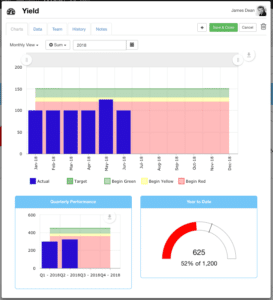
- Yield
Everyone should have these important metrics clearly defined. This is because they need to be closely monitored if you want to achieve the goals that these metrics are linked to.
This sounds like a tall order, but you don’t have to fill it alone.
We can help! KPI Fire provides a simple, visual way to not only see your metrics, but link all of your Goals and Projects to your Metrics as well.
Click on the link below to request a demo.
The video below shows how easy it is to use our KPI Dashboards.


