
Join us as we explore the concept of value stream mapping (VSM), its benefits and the steps involved in creating your own value stream map. We also highlight how value stream mapping can be used in conjunction with KPI Fire’s continuous improvement software to drive continuous improvement and enhance organizational performance. How can value stream mapping help your organization optimize processes? Read on to discover useful tips and tricks to enhance efficiency with VSM.
What is Value Stream Mapping?
Value Stream Mapping is a powerful tool used in Lean process improvement to visualize the flow of materials, information, and value through a process. By creating a visual representation of the entire process, organizations can identify the eight wastes, bottlenecks, and opportunities for improvement. Value stream mapping involves identifying all the steps involved in a process, from the initial customer request to the final delivery of the product or service. This helps to visualize the entire process and identify areas where value is added and where waste occurs. By understanding the flow of value, organizations can achieve a range of benefits.
What are the Benefits of Value Stream Mapping?
By visualizing the flow of materials, information, and value through a process, organizations are at liberty to gain a deeper understanding of their operations and identify opportunities for improvement. Value stream mapping offers numerous benefits for organizations, including:
Identification of waste
Waste, in the context of value stream mapping, refers to any activity that does not add value from the customer’s perspective. By visualizing the process, organizations can easily identify the eight types of waste in Lean. By identifying and eliminating these types of waste, organizations can significantly improve their efficiency, quality, and productivity.
Improved process flow
Improved process flow is one of the key benefits of value stream mapping. By identifying and eliminating waste in a process, organizations can create a smoother and more efficient flow of materials, information, and value. This can lead to reduced cycle time, which is the time it takes to complete a process can be significantly reduced, leading to faster delivery of products or services. Improved process flow also leads to increased throughput, which is the rate at which products or services are produced can be increased, leading to higher productivity and revenue.
Moreover, improved process flow by means of value stream mapping leads to reduced costs, since eliminating waste and inefficiencies can lead to lower operating costs, such as reduced labor, materials, and overhead expenses. Other positive effects of improved process flow include improved quality, enhanced customer satisfaction and increased employee morale. Overall, improved process flow is a critical benefit of value stream mapping that can have a significant impact on an organization’s performance.
Enhanced collaboration
Enhanced collaboration is another key benefit of value stream mapping. By creating a visual representation of the entire process, value stream mapping can help to foster a shared understanding. All stakeholders can see the entire process and understand how their roles fit into the bigger picture. Enhanced collaboration also encourages teamwork in the manner that everyone is working towards a common goal. By involving employees in the value stream mapping process, organizations can empower them to identify and implement improvements. Overall, enhanced collaboration is a critical benefit of value stream mapping that can help organizations to achieve their goals more effectively.
Data-driven decision making
Data-driven decision making is another key benefit of value stream mapping. By providing a visual representation of the entire process and collecting data on key performance indicators (KPIs), value stream mapping can help organizations to identify bottlenecks and pinpoint areas where the process is slow or inefficient.
Key metrics to track include cycle time, throughput, and defect rates. You can make informed decisions by using data to make evidence-based decisions about process improvements. Also, be sure to allocate resources to areas where they will have the greatest impact. Support continuous improvement best practices by using data to identify areas for improvement and track progress over time. By leveraging data-driven decision making, organizations can make more informed choices, optimize their processes, and achieve better results.
Continuous Improvement
Value stream mapping can serve as a valuable tool for supporting continuous improvement methodologies and relative efforts by providing a baseline for measuring progress and identifying future improvement opportunities. Continuous Improvement flowchart frameworks may also be utilized for the execution of VSM. Refer to the section “Frameworks & Templates” further down in this article for more guidance.
Essential Elements of a Value Stream Map
A value stream map is a visual representation of the flow of materials, information, and value through a process. It typically includes the following elements:
- Process Steps: Each step in the process is represented by a box or rectangle.
- Flow Arrows: Arrows connect the steps to show the sequence of activities.
- Information Flow: Arrows may also be used to represent the flow of information between steps.
- Inventory: Symbols or icons are used to represent inventory at different points in the process.
- Data: Data related to the process, such as cycle time, lead time, and defect rates, can be included on the map.
- Waste: The seven types of waste can be identified and highlighted on the map.
- Customer and Supplier: The starting point and ending point of the process are typically represented by a diamond shape, representing the customer and supplier.
By including these elements, a value stream map provides a comprehensive overview of the process and helps to identify areas for improvement.
The Steps Involved in Value Stream Mapping
You can create clear and detailed Value Stream Maps to represent your processes with the intention of enhancing efficiency and productivity. By identifying waste and bottlenecks that tend to pop up in value stream maps, organizations can streamline processes and improve efficiency. Below are the steps involved in creating a value stream map:
1. Identify the Process:
The first step is to determine the process you want to map. This could be any process within your organization, such as:
- Manufacturing processes: Assembling a product, producing a component, or packaging a product.
- Service delivery processes: Providing customer service, processing orders, or delivering a service.
- Administrative processes: Handling paperwork, managing projects, or financial reporting.
- Supply chain processes: Managing the flow of materials and products through the supply chain.
When selecting a process to map, consider its importance. Be sure to choose a process that is critical to your organization’s success or that has significant room for improvement. Also consider and determine the scope of the process you want to map. Will you map the entire process from start to finish, or will you focus on a specific part of the process? By carefully selecting the process to be mapped, you can ensure that the value stream mapping exercise will be valuable and informative.
2. Gather Data
Consider data availability by ensuring that you have the necessary data to create a detailed map of the process. Collect data on the process, including the sequence of activities, time taken for each step, and the movement of materials or information. Choose appropriate metrics to track performance of process improvements in KPI Fire.
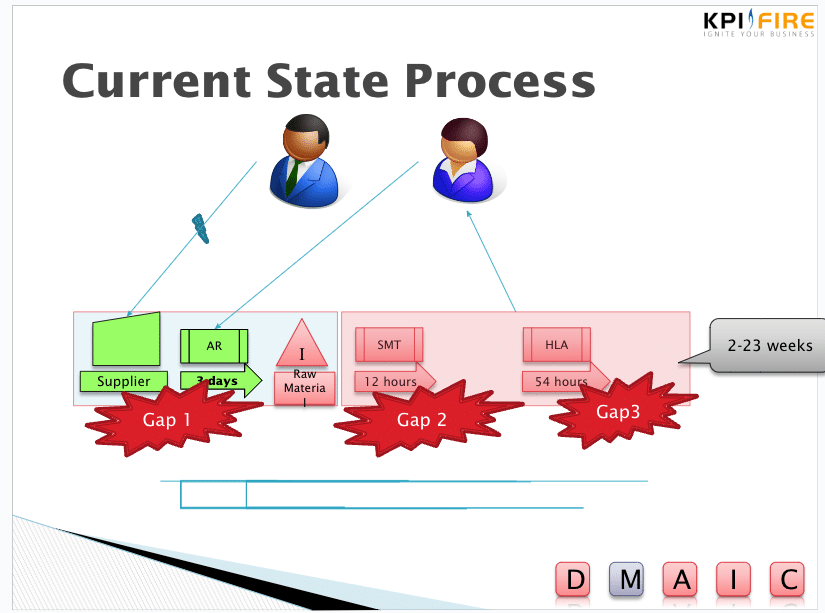
3. Create a Current State Map
Create a visual representation of the current state of the process. This map should show the flow of materials, information, and value. Ideally the stakeholders should have a first-hand view of all the activities. Take a Gemba walk to assist with this step.
4. Identify Waste
Analyze the current state map to identify the different types of waste. Look for instances of overproduction, waiting, transportation, processing, inventory, motion, defects, and underutilization of talent. Refer to our blog on the eight wastes of lean and how to eliminate them for more guidance here. By identifying non-value-adding activities in your processes and by highlighting areas of waste, it’s easier to pinpoint inefficient processes, gaps or unnecessary steps in the value stream.
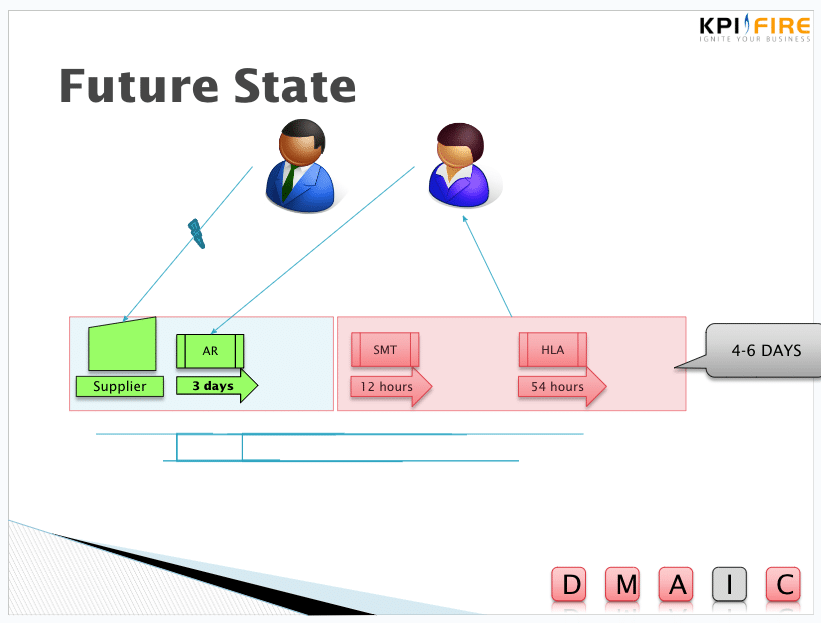
5. Create a Future State Map
Develop a vision for how the process should ideally work, eliminating waste and improving efficiency.
Future state Value Stream Map example:
6. Implement Improvements
At this stage, it’s time to develop a plan to transition from the current state to the future state. Use KPI software to track progress and measure the impact of your improvements.
7. Continuously Improve
Continue to monitor and analyze your processes using KPI Fire. Identify new areas for improvement and implement changes as needed. Map, analyze, and improve your value streams to eliminate waste and maximize productivity. Then, continue to monitor and analyze your processes using KPI Fire software. Identify new areas for improvement and implement more changes as needed.
Value Stream Mapping Frameworks & Templates
DMAIC
Using DMAIC to optimize processes in conjunction with value stream mapping is a structured approach to process improvement. By using DMAIC and value stream mapping together, organizations can gain a deeper understanding of their processes, identify areas for improvement, and implement effective solutions. Instead of following steps 1-7 to create a value stream map, you can follow the DMAIC structure to do the same.
SIPOC
SIPOC is another valuable tool for defining the boundaries of a process and identifying its key elements. When combined with value stream mapping, SIPOC can provide a comprehensive understanding of a process and its opportunities for improvement. Be sure to read our blog on how to use SIPOC to enhance process efficiency.
Identifying Appropriate KPIs in Value Stream Mapping
Key Performance Indicators are essential for measuring the effectiveness of your value stream mapping initiatives. By tracking relevant KPIs, you can quantify improvements, identify areas for further action, and demonstrate the value of your efforts. Here are some key KPIs to consider for value stream mapping:
Process Efficiency:
- Takt time: A metric used in value stream mapping to determine the required production rate to meet customer demand. It is calculated by dividing the available production time by the required output.
- Cycle time: The total time it takes to complete a process from start to finish.
- Throughput: The rate at which products or services are produced.
- Utilization: The percentage of time that resources (e.g., equipment, labor) are actively used.
- Lead time: The time it takes for a product or service to move through the entire process.
Quality:
- Defect rate: The number of defects or errors in products or services.
- Yield: The percentage of good units produced compared to total output.
- Customer satisfaction: Measures of customer satisfaction, such as customer surveys or feedback.
Cost:
- Total cost of ownership: The total cost of a product or service, including direct costs, indirect costs, and opportunity costs.
- Inventory costs: The cost of holding inventory, including storage costs, obsolescence costs, and opportunity costs.
- Waste costs: The cost of waste, such as overproduction, waiting, transportation, processing, inventory, motion, defects, and underutilization of talent.
Employee Engagement
- Turnover rate: The rate at which employees leave the organization.
- Employee suggestions: The number of suggestions for improvement submitted by employees.
- Employee satisfaction: Measures of employee satisfaction and engagement.
By tracking these KPIs, you can measure the impact of your value stream mapping initiatives and identify areas for further improvement. It’s important to select KPIs that are relevant to your specific process and goals. Additionally, consider using a combination of quantitative and qualitative data to get a comprehensive picture of your process’s performance.
Real-World Applications of Value Stream Mapping
Value stream mapping can be applied to a wide range of processes across various industries. Here are some examples:
Manufacturing
- Automotive assembly line: Map the flow of materials and information from raw materials to the finished product.
- Electronics production: Analyze the process of assembling electronic components into a finished product.
Healthcare
- Patient registration: Map the process of registering a patient for treatment.
- Medication administration: Analyze the process of administering medication to patients.
Service Industry
- Customer service call center: Map the process of handling customer inquiries and complaints.
- Restaurant operations: Analyze the process of taking orders, preparing food, and serving customers.
Government
- Permit approval process: Map the process of approving permits or licenses.
- Citizen services: Analyze the process of delivering services to citizens.
Office Administration
- Document processing: Map the process of creating, reviewing, and approving documents.
- Purchasing: Analyze the process of purchasing goods and services.
By applying value stream mapping to these processes, organizations can identify waste, bottlenecks, and opportunities for improvement. This can lead to increased efficiency, reduced costs, and improved customer satisfaction.
Using KPI Fire to Support Value Stream Mapping
KPI Fire can provide valuable support for value stream mapping and other strategic initiatives. Key features of KPI Fire that can be used for value stream mapping include:
KPI Tracking
Track key performance indicators (KPIs) and metrics with KPI Fire’s executive dashboards. Track your lean process improvement initiatives in terms of KPIs and metrics to measure progress and identify areas for further action. Choose appropriate metrics from the value stream map to monitor inside of KPI Fire in order to leverage a combined effort.
Huddleboards
The simplest way to evaluate the success of any business or value stream is to start with the numbers. KPI Fire makes it easy to create a HuddleBoard which can be used for periodic (Daily/Weekly/Monthly/Quarterly) business reviews. Be sure to view our Huddleboard examples blog and learn how to use a huddle board in conjunction with value stream mapping.
Collaboration
KPI Fire’s collaboration features such as the idea funnel enable teams to work together on value stream mapping projects and share insights and improvement ideas.
By leveraging KPI Fire’s features, organizations can gain a deeper understanding of their processes alongside value stream mapping techniques, identify opportunities for improvement, and drive continuous improvement. Request your demo today to see these features in action.


