In today’s competitive business landscape, streamlining processes and maximizing efficiency are crucial for success. SIPOC can be a powerful tool for process improvement, potentially beneficial to any company in terms of financial throughput, time, and resources.
When used alongside KPI software, SIPOC can serve as the foundation of a powerful game-changer for organizations of all sizes. Where SIPOC helps visualize the process flow, KPI tracking allows you to quantify performance.
This article takes a closer look at SIPOC and how to unlock process excellence in your organization by combining it with KPI tracking.
What is SIPOC?
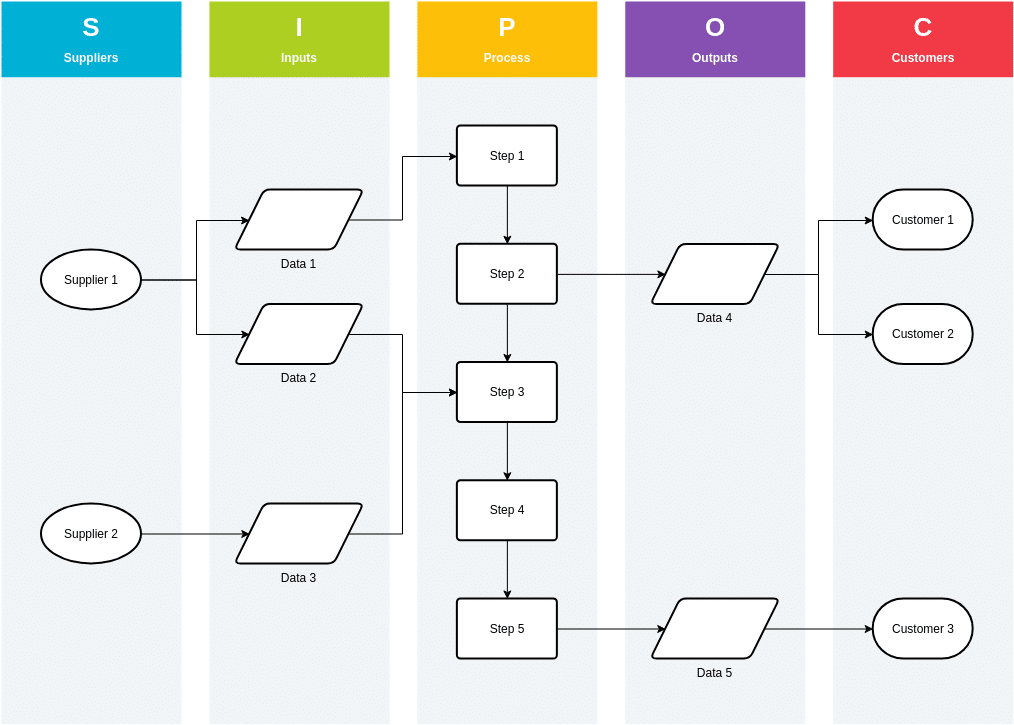
SIPOC stands for Suppliers, Inputs, Process, Outputs, and Customers. It’s a tool used in Lean and Six Sigma process improvement methodologies to map out a business process. Here’s a breakdown of what each part represents:
- Suppliers: Who or what provides the materials, information, or anything else needed for the process to begin?
- Inputs: What are the specific raw materials, data, or information that enter the process?
- Process: The steps involved in transforming the inputs into the outputs.
- Outputs: The finished product or service created by the process.
- Customers: Who receives the outputs of the process? (Internal or external customers)
The SIPOC diagram is a simple table that visually represents these five elements and provides a high-level process map. To create your own SIPOC diagram, you need to identify the area in need and subsequently map your processes. Let’s take it from the top all the way down to improved efficiency and increased bottom-line profits with the help of SIPOC and KPI tracking tools.
Benefits of SIPOC Process Mapping
This section reveals the benefits to be claimed by incorporating SIPOC Process Mapping into your current strategy.
- Clear Process Visualization
- Enhanced Communication
- Process Improvements
- Better Customer Focus
- Facilitates Root Cause Analysis
- Supports Risk Management
How to Create a SIPOC Diagram Step-By-Step
This section explains how to create the ideal SIPOC diagram. Follow the steps below to create your unique diagram.
1. Assemble the Team
- Include diverse team members that are familiar with the process.
2. Define the Process
- Make sure to clearly define the scope and boundaries of the process.
- Select the starting and ending points of the process.
3. Identify the Five Components of SIPOC
4. Draw the SIPOC Diagram
5. Validate the Diagram
- Review the diagram with stakeholders to ensure accuracy.
6. Use the Diagram for Further Analysis
Continuously Improve With Our Latest News & Updates
Using SIPOC Templates
SIPOC templates typically consist of a table with sections for Suppliers, Inputs, Process, Outputs, and Customers. You can download a Free Sipoc Template here. Fill out your SIPOC Table. For each section, describe the relevant details as shown in the example below.
")
Linking KPIs with Each Stage of SIPOC
For each stage of the process (identified in the SIPOC diagram), be sure to link relevant KPIs that will help you gauge its effectiveness within KPI Fire. These KPIs could relate to efficiency, Quality, or Cost. Analyze your SIPOC diagram and identify areas where delays, errors, or inefficiencies might occur. Focus on stages with a high potential impact on overall process performance or customer satisfaction.
Easily and effectively link SIPOC stages with KPIs by utilizing KPI Fire’s Projects and Metrics features. While not mandatory, you can create separate projects in KPI Fire for each stage of your SIPOC diagram. This can help organize your KPIs and make it easier to track performance for each stage. Alternatively, you can create a single project encompassing the entire process.
When creating or editing a project in KPI Fire, you’ll find a section for adding Metrics. Here, define the KPIs you identified for the corresponding SIPOC stage. KPI Fire provides a simple, visual way to link Goals and Projects to your Metrics.
")
Integrating SIPOC with Idea Funnel
By integrating SIPOC with KPI Fire’s Idea Funnel, you can create a robust system for identifying, evaluating, and implementing the most impactful improvement ideas within your organization. As you move your ideas through KPI Fire’s funnel, consider SIPOC to strengthen your evaluation.
Identify who submits ideas (suppliers) and how (inputs) during capture. When screening, use SIPOC to set criteria. Then, deep dive using SIPOC: understand who implements (suppliers), what resources are required (inputs), how it will be done (process), expected outcomes (outputs), and who benefits (customer). This SIPOC lens ensures your chosen ideas align with your resources and have a clear path to implementation.

Leveraging SIPOC for Effective Goal Setting
By mapping out SIPOC elements, you gain valuable insights that can be used to set effective goals within the goal-setting feature of KPI Fire. Here’s how they work together:
1. Identifying Processes and Improvement Areas:
- SIPOC helps you visualize key processes within your organization.
- Analyze these processes to identify areas for improvement.
- Look for bottlenecks, inefficiencies, or areas not meeting customer needs
2. Translating Process Analysis into Goals:
- Once you’ve identified improvement areas, use them to set specific, measurable goals in KPI Fire.
- For example, SIPOC might reveal a slow order fulfillment process.
- Your goal in KPI Fire could be to “Reduce order fulfillment cycle time by 20% within the next quarter.”
3. Aligning Goals with SIPOC Elements:
- Use SIPOC elements to refine your goals in KPI Fire:
- Suppliers: Goals might target improving the quality or timeliness of inputs received from suppliers. (e.g., Reduce material defects by 15%)
- Outputs: Set goals to improve the quality or efficiency of process outputs. (e.g., Increase product yield by 5%)
- Customers: Ensure goals align with customer needs and expectations. (e.g., Increase customer satisfaction rating by 10%)
4. Selecting Relevant KPIs:
- With your goals defined, use SIPOC to identify relevant KPIs to track progress in KPI Fire.
- For example, a goal to reduce order processing errors (identified using SIPOC) could be linked to a KPI for “Order processing accuracy” in KPI Fire.
By combining SIPOC’s process mapping with KPI Fire’s goal-setting features such as X Matrix, you create a data-driven approach to improve your business processes and achieve strategic objectives.
Optimize Processes with SIPOC and KPI Fire
Remember, SIPOC helps visualize the process flow, while KPI Fire allows you to quantify performance. By using them together, you can gain a deeper understanding of your processes, identify areas for improvement, and track the effectiveness of your efforts.
You can leverage your SIPOC diagram most effectively with KPI Fire. Be sure to book a demo to see firsthand how KPI Fire can help you optimize your operational efficiency.


