The following improvements are Release 161, (Release date July 24, 2018)
The following updates were made as part of this release:
- Metric Tile Toggle Options. Click the mouseover arrows on the left or right side of the metric tile to display other tile views.

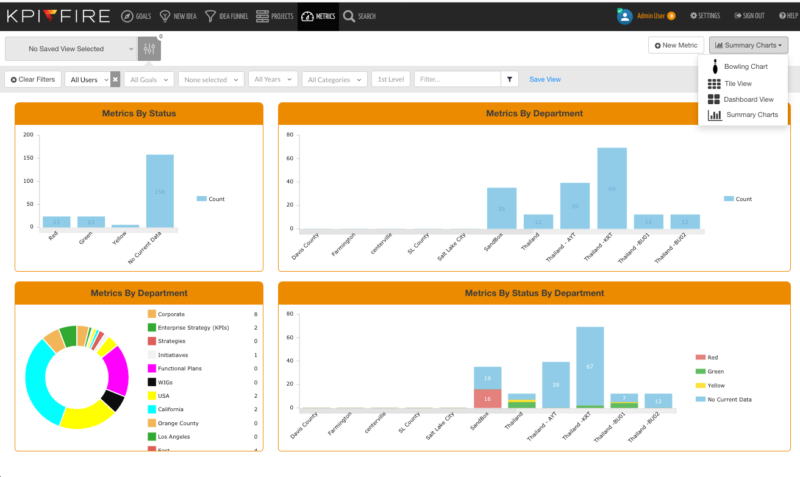
- Metrics: New Summary chart for metrics: See a summary of your metrics by department and by color.
- Filters:
- Small change to department filter to clear selected department. If you don’t select any department after clearing the filter, it will be set to your default filter.
- View Only license type can now see Goal Filter.
- Click the small “x” on user or Department filter to reset it to its default value.

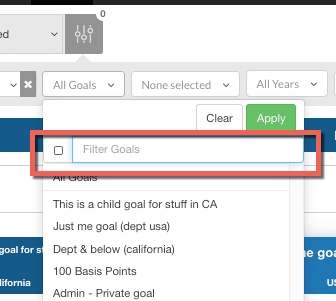
- Goal filter now has a searchable field for locating goals with a few keystrokes rather than sorting through long lists.
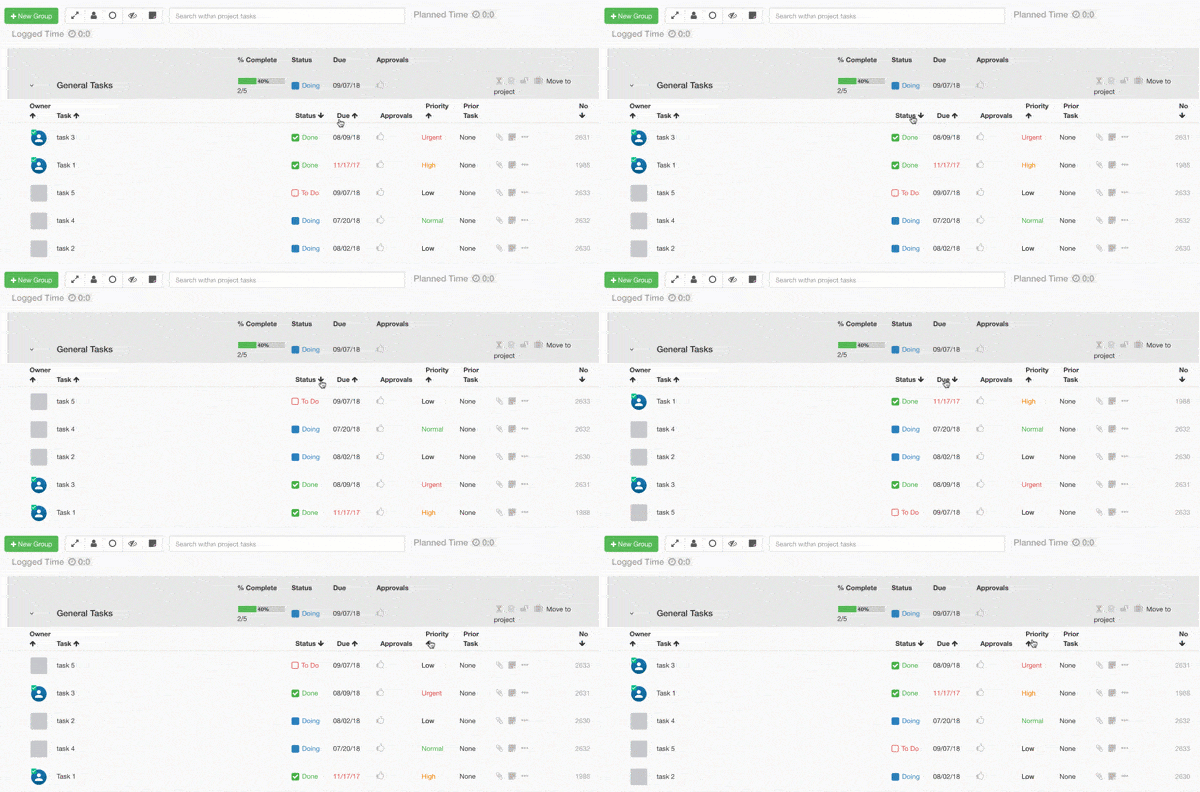
- Projects: Workflow tab, added sort by options for: Owner, Task Name, Status, Due Date, and Priority
Various Bug Fixes:
- User Stats page Bar Chart: Control Stage projects now show in their own column.
- Timeline views: Fixed issue in Chrome Browser where right side would not drag.
- Fixed issue with metric import with some start date months.
August 13, 2018
- Updated gradient color on Idea Funnel
- Fixed bug on Text filter if a metric name was empty
- Fixed bug on text filter for user names with spaces


