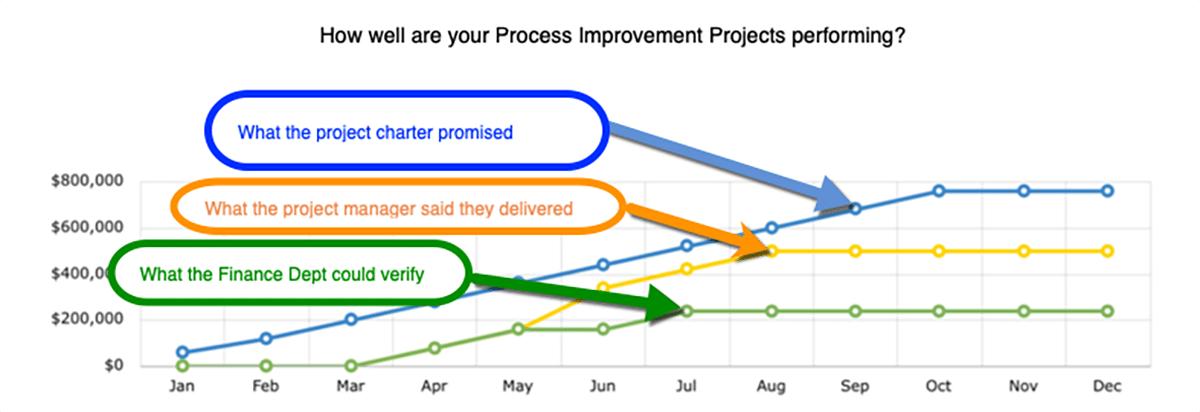
One of the key roles of Strategic Portfolio Management (SPM) is to track and report the financial benefits of project work within the organization. This is particularly true of any large scale change or continuous improvement initiative. The organization simply demands to know what it’s getting for its investments. To this end, it’s important to roll up the savings or other benefits realized. So we gather all the projects we’re working, and pull together the value. We report the value with confidence.
Now let’s play through a little scenario. One of our key executives is impressed with the great savings being reported. She wants to know more, so she digs into one of the projects to better understand where these impressive savings are coming from. And what does she find? Questionable assumptions and over-aggressive estimates.
It’s easy to see how this happens. Project managers are pushed to produce higher realized benefits. With this pressure to produce, it’s easy to see how the impact of a project might get stretched a bit. In fact, it’s so common there’s a name for these types of aggressive savings estimates. They’re called PPDs, which stands for PowerPoint Dollars. They often appear in PowerPoint business case presentations claiming fantastic savings. But the problem with PPDs is that they never make it to the bottom line.

Let’s face it; there’s generally very little argument about the reality of the costs involved in project work. We know the equipment we’re purchasing and we can easily track the labor costs involved. The “Costs” show up loud and clear on department budget reports and on the P&L.
However, to demonstrate project benefits often relies on a whole host of debatable assumptions. Typical assumptions go something like this: If we make investment in this project we will reduce scrap by X%, and produce X more tons per shift without adding people. Considering the cost of materials per ton and the FTE annual salary and benefits that all translates to $X in scrap savings per year and $X in labor savings.
So, back to our inquisitive executive, who looks into a project’s benefits assumptions and finds them unconvincing. She thinks, “If this project’s savings are unrealistic, then how can I trust any of the numbers coming from the PMO’s reports?”
All the other projects may have perfectly sound and realistic savings projections. But this one project has produced the toxic numbers that begin to erode leadership support.

Additional Resources:
Achieve Portfolio Impact Targets
The KPI Fire Project Benefit Budget Report can help you visualize progress toward business improvement portfolio goals. Learn more…
How to Calculate Savings from Lean Six Sigma and Continuous Improvement Projects
Watch instructional video…
What are Hard vs Soft Savings?
What Counts Can Be Counted Read article…
How to Convert Process Metric Improvements into Business Value Learn more…
Let us show how KPI Fire can help you.
Request your free, no obligation demo today…
To overcome this common failure it’s important to implement a process of review and validation; a process all key stakeholders agree to, and can trust. There are many ways to accomplish this.
KPI Fire provides project benefit approvals and validation. Each project is assigned a financial approver; an individual trained in the agreed upon reporting methods. That financial approver has the unique authority to audit and review the assumptions and to lock the numbers as valid.
Whatever the process used, the important part is that everyone understands the validation process and agrees with it. With this process in place key stakeholders can have confidence that reported savings and benefits are real. And that goes a long way in driving leadership support and long-term success in any Continuous Improvement initiative.


