Achieve Portfolio Impact Targets
The Project Benefit Budget report can help you visualize progress toward business improvement portfolio goals. The report below depicts a scenario with a company with a $2,000,000 savings goal which is allocated to 2 departments, commercial and industrial business units.
Project Benefits Budget Report
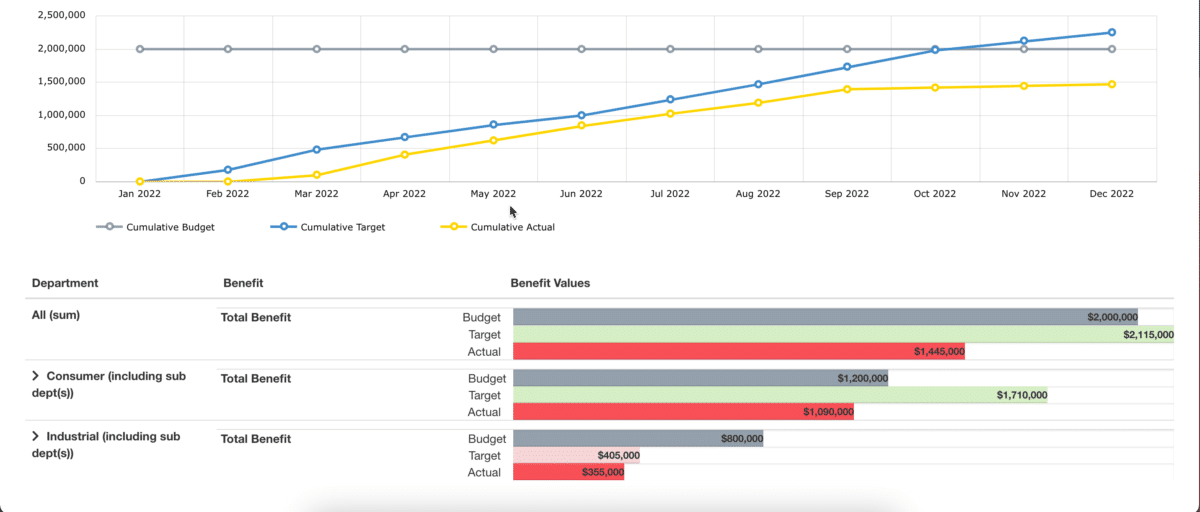
Note the following details in the screenshot above:
- Green is good. A green bar on target or actual indicates the amount exceeds the budgeted or desired amount.
- Red means needs attention. A red bar indicates the target or actual amount is below the budgeted or desired amount.
The All(sum) line represents a Combined Cost Savings Target of $2,000,000 for the calendar year.
The green bar line target of the project benefits identified is $2,115,000. This number means that if the identified projects are expected to exceed the budget.
The red actual line of $1,445,000 indicates that the identified projects have not yet delivered on their potential.
How can this report help you manage your Business Improvement Program activities?
If you are performing below your Budget at the Highest or All Level, then we have a problem we need to solve. One of the first rules of problem solving is to localize the problem. Since we have set budgets at the business unit or department level. We can compare performance of those units/departments.
The Consumer business unit has identified enough projects that should help it achieve its budgeted numbers. The focus for this groups should be on completing the identified projects.
The Industrial department is where the problem lies. It has a budget of $800,000 cost savings, and has only identified projects totaling $405,000. This group needs to spend some time identifying projects that can help it achieve its goals. This might also be a leadership issue, where the leaders of the Industrial unit may not be bought in and aggressively managing improvement projects.
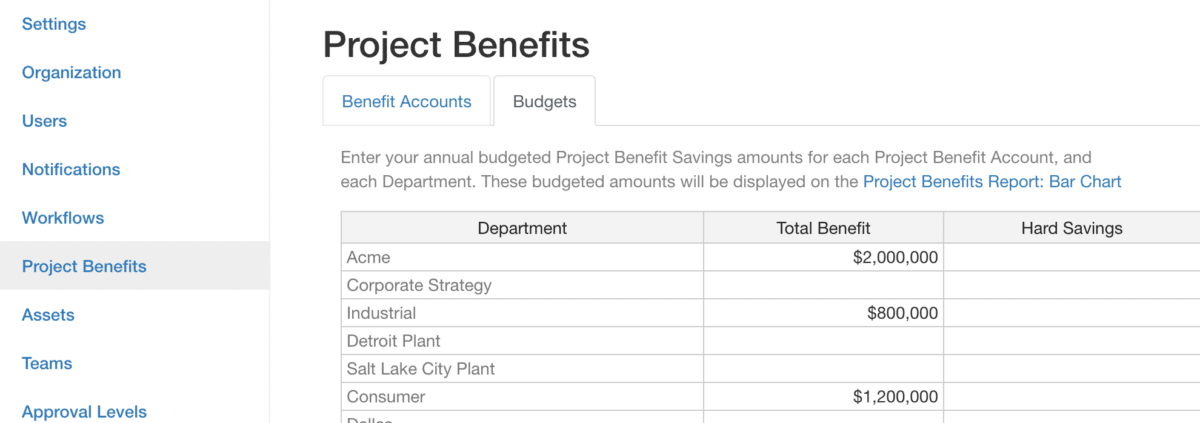
To use this report in your KPI Fire account:
- Setup Project Benefit Budgets. Settings>Project Benefits (Requires Admin access)
- Create Projects, add Project Benefits (Target and/or Actuals)
- Select Project Benefit Budget Report
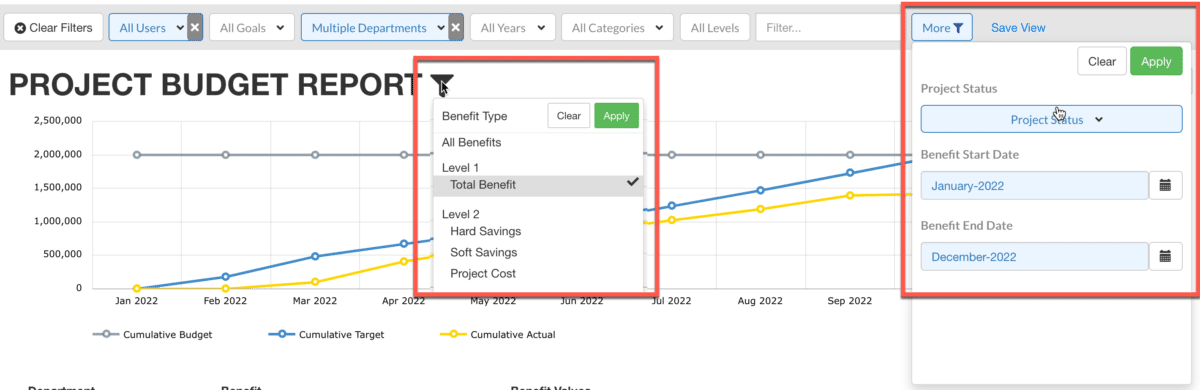
- Configure filters on report
Scenario #2: Project Benefits Budget Report
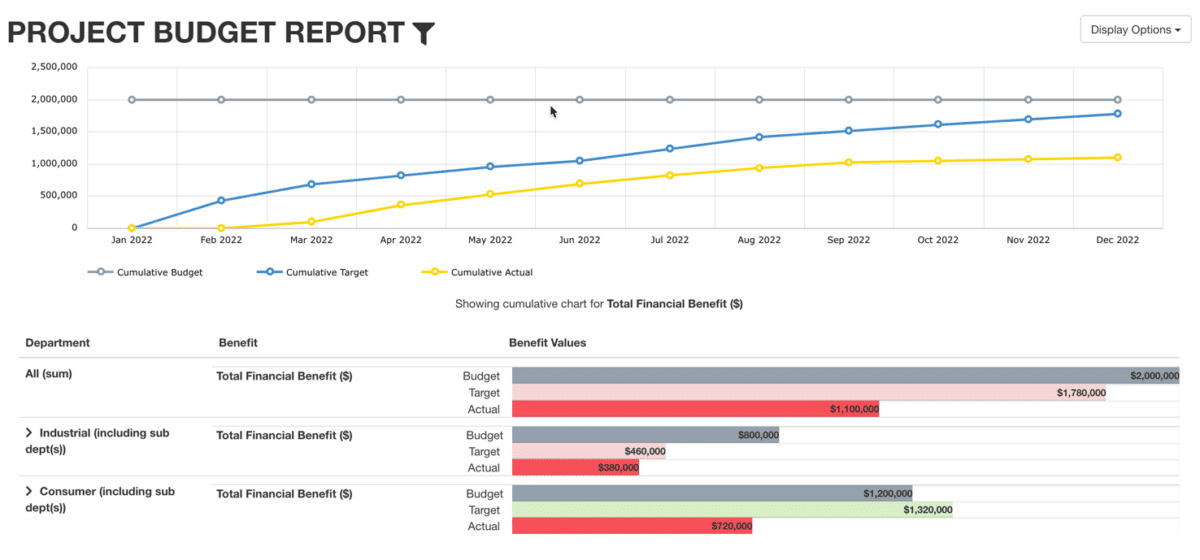
In the chart above you can see that this scenario is a bit different. In this scenario the total Targets are below the Annual Budget Amount. The charts below show that the Consumer group has identified enough projects to help it achieve its goal. However, the Industrial group has not. This is another example of how to localize the problem area and to apply additional management focus or attention in the problem area.
- Global filters
- “more” filters for filtering by project status or benefit month
- Filter Icon to limit chart to a single Project Benefit Account.


