Product Enhancements – Release Notes January 2022
We are happy to announce some new enhancements & fixes:
(Last Release January 27, 2022)
Note: if you don’t see the same thing in your account, try clearing your cache/cookies or use a “new private window” to refresh the cache.
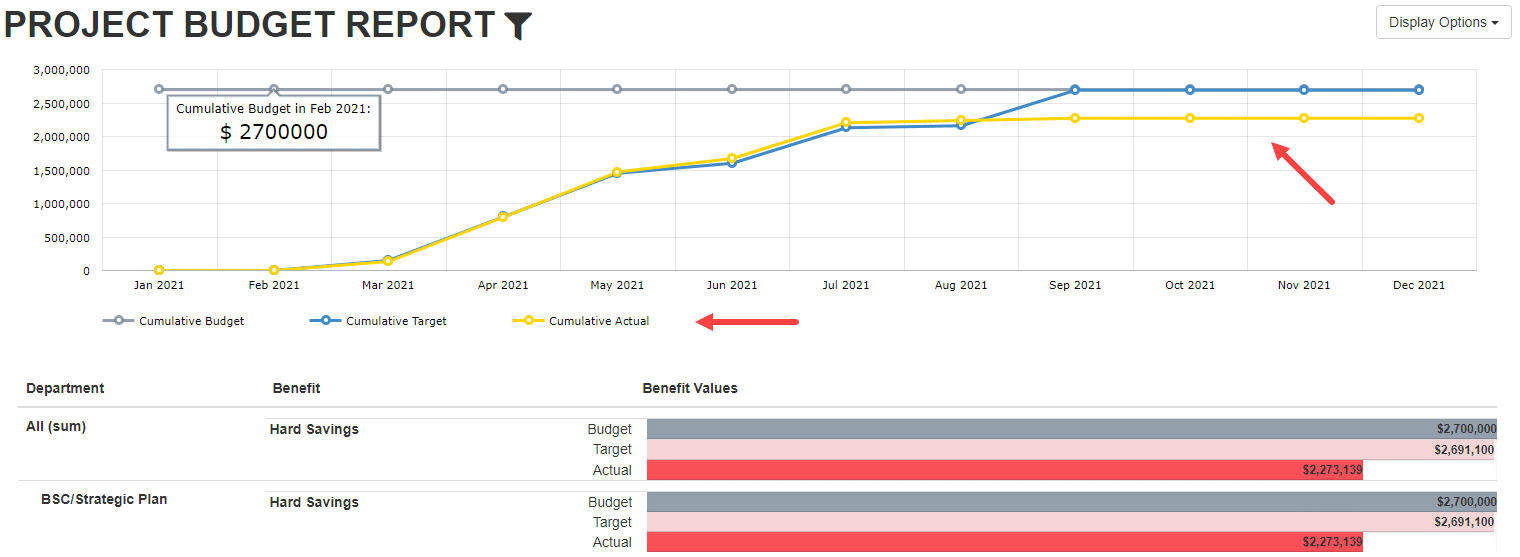
Reports > Project Budget Report
- NEW Added a new timeline-based CUMULATIVE Chart which allows seeing the cumulative benefits by month over time.
- Removed the summary tiles at top of the page.
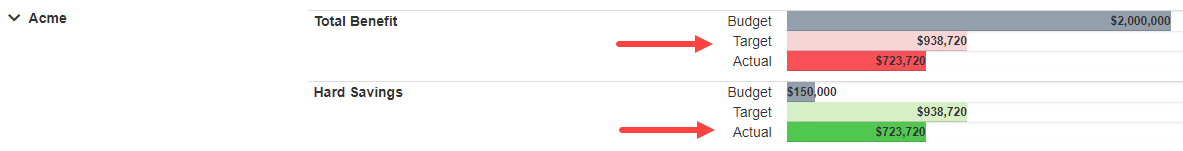
Reports > Project Budget Report
- NEW added color for Budget, Target, and Actual
- Budget color – Grey
- If Target $ => Budget – Target would be light Green
- If Target $ < Budget – Target would be light Red
- If Actual $ => Budget – Actual would be Green
- If Actual $ < Budget – Actual would be Red
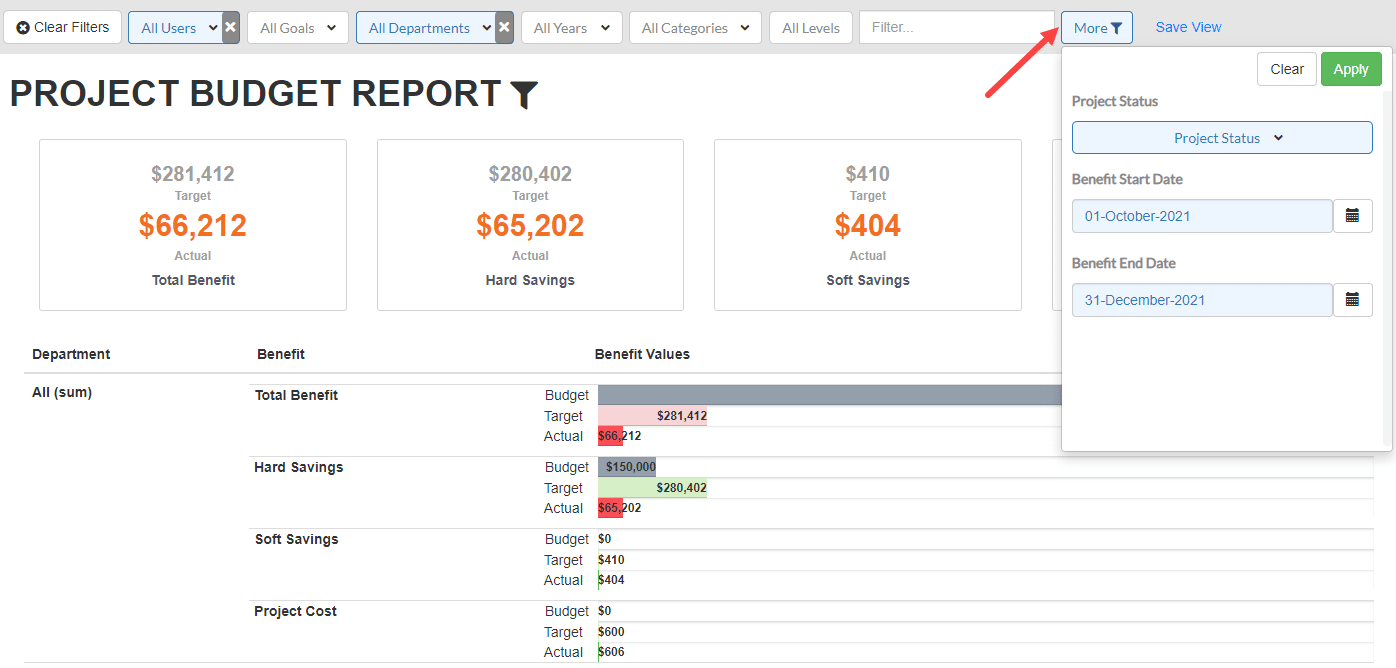
Reports > Project Budget Report
- NEW added More Filter which allows filtering the total benefits report by project status and benefits start and end date range
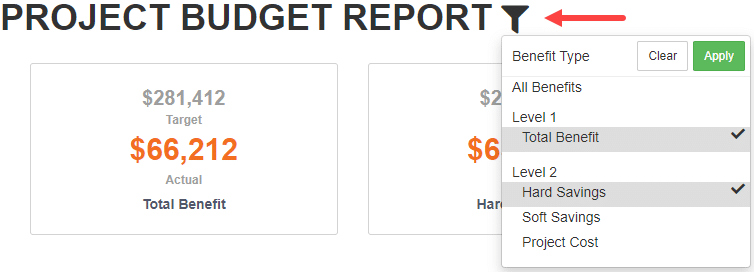
Reports > Project Budget Report
- NEW added functionality of remembering last selection within the session for Benefit Type filter
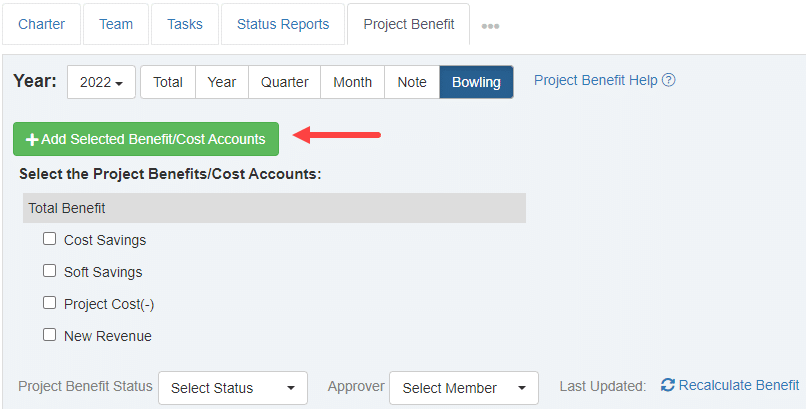
Project > Project Benefit Tab
- NEW Added option to select multiple benefit accounts in projects, where there are no previously selected benefits.
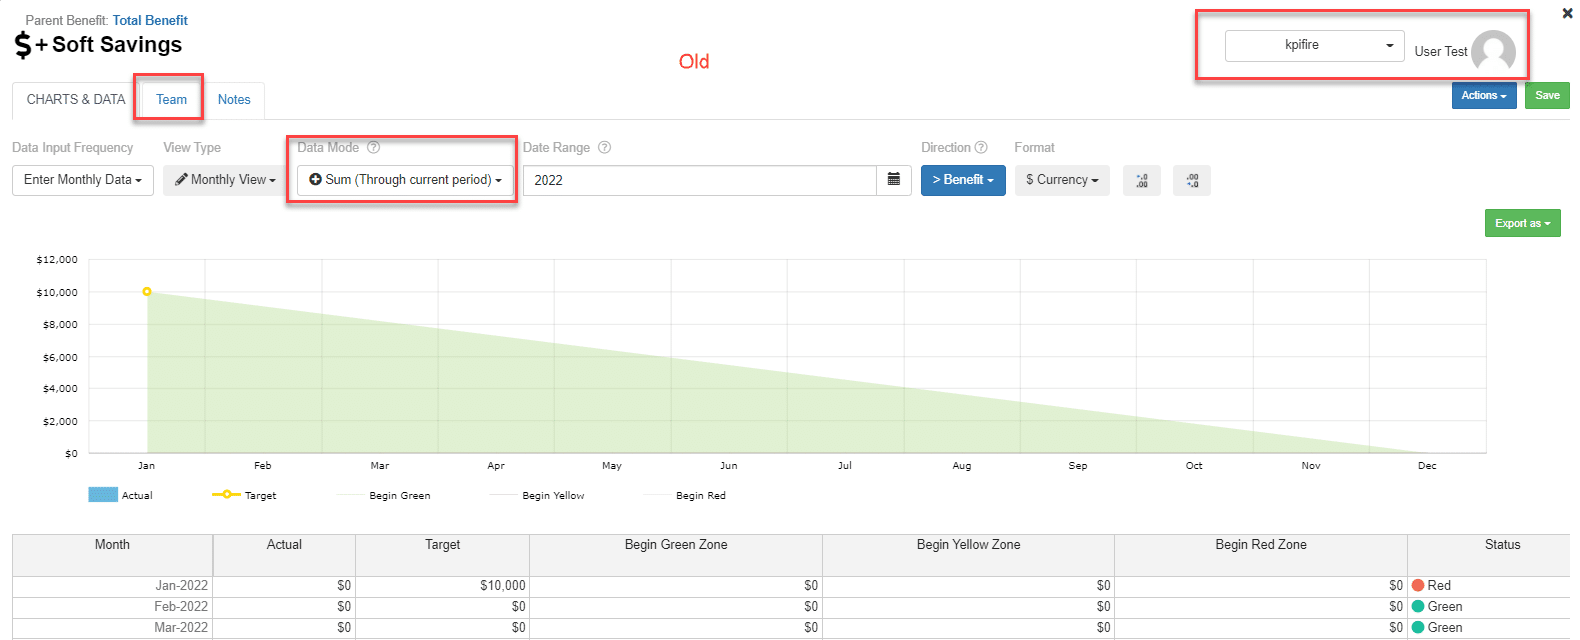
Project > Project Benefit Tab
- NEW Changed the UI of project benefit pop-up
- Removed – Department, User Name, Team tab, and Data Mode from the pop-up
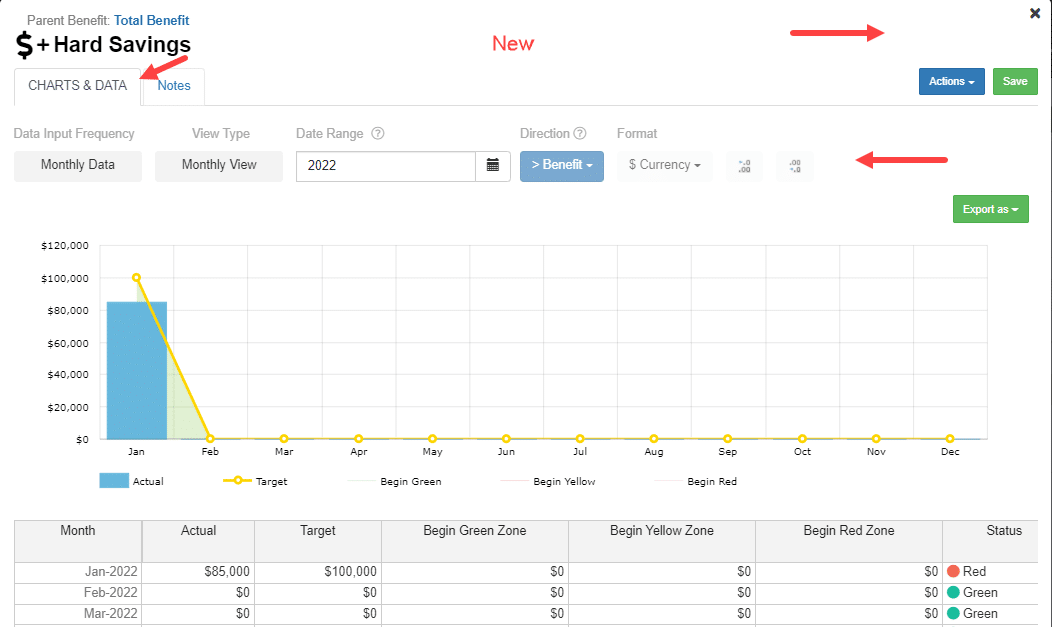
Settings > Project Benefit Tab (For Administrator License only)
- NEW Changed the UI of project benefit pop-up
- Removed – Department, User Name, Team tab, Data Mode, Date Range, and Graph from the pop-up
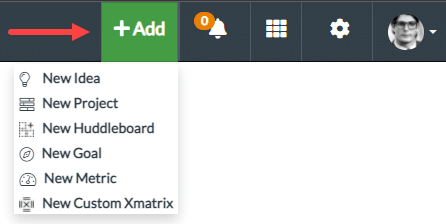
Main Menu
- NEW “Add” button added in the main header
- Allows to add I/P/G/M/HB/Custom X Matrix from this button
- Options visibility depend upon license types
- Removed add I/P/G/M/HB from individual page views
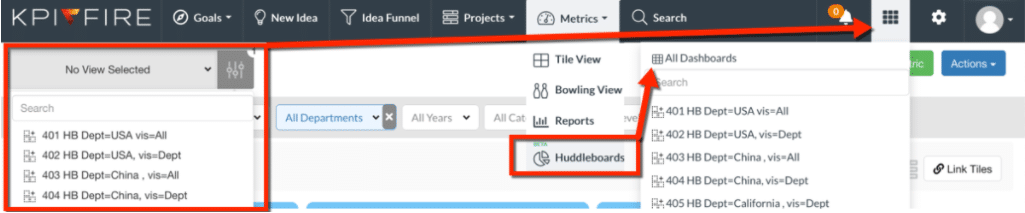
Main Menu
- Saved view dropdown removed (Can access saved views from Waffle menu)
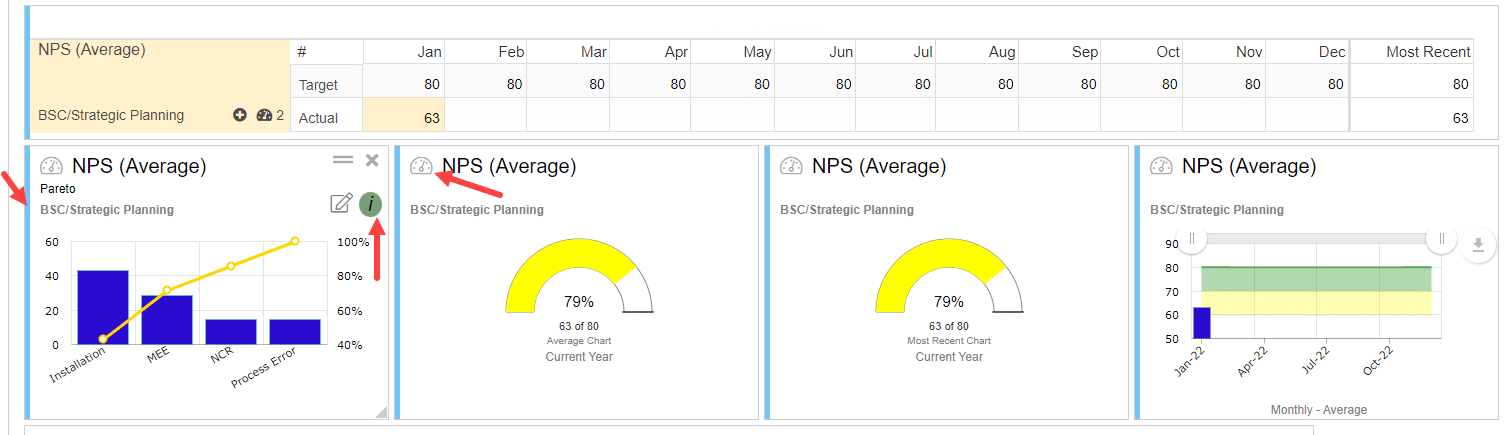
Huddleboard > Metrics Tile
- NEW added category color on hover over “i” icon
- Added metric icon with title
- Added blue bar on the left side
Metrics Bowling view & Huddleboard
- NEW added mouse hover effect for date on weekly metrics

Metrics – External API
- NEW added year parameter for getting data for all metrics
Metric/Project/Goal > Tile/Bowling views
- NEW removed project, goal, metric icon to toggle view and Link Tiles button
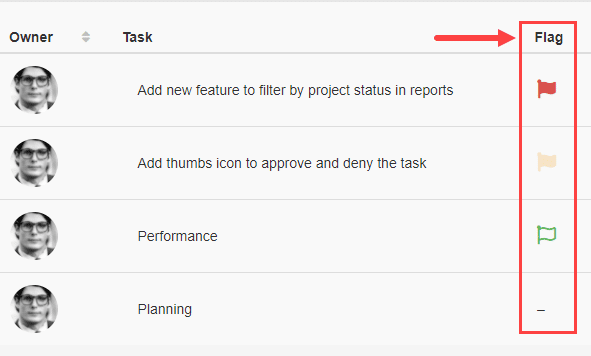
Project > Task Tab
- NEW added the flag column for the task which allows marking the task as Red, Amber, and Green.
- Also, added in the Import/Export files.
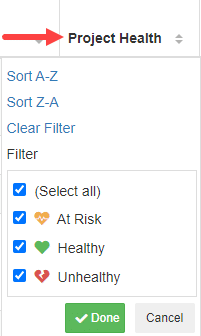
Project List View
- NEW added health column filter
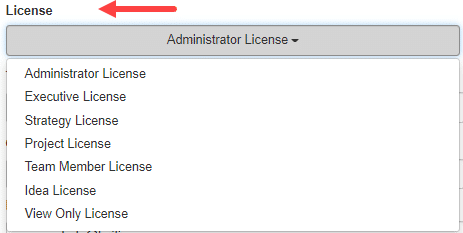
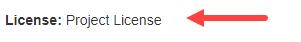
User Profile Page:
- Profile Settings –> NEW added user license type

